Estrategia de trading cuantitativo mejorada con seguimiento de tendencias de múltiples indicadores

Descripción general
La estrategia es una estrategia de seguimiento de tendencias basada en múltiples indicadores técnicos, que integra varios indicadores técnicos, como el promedio móvil (EMA), el indicador de tendencia promedio (ADX) y el indicador de relativa debilidad (RSI), y combina métodos de análisis de múltiples marcos temporales. La estrategia se basa principalmente en la identificación de la dirección de la tendencia a través de cruces de EMA rápidos y lentos, el uso de ADX para filtrar la fuerza de la tendencia, y el RSI para juzgar el movimiento del mercado, con lo que se realiza una negociación de alta frecuencia en el gráfico de 1 minuto.
Principio de estrategia
La estrategia se basa en los siguientes mecanismos centrales:
- Utiliza EMA de 50 y 200 ciclos para identificar la dirección de la tendencia y confirma la señal de entrada mediante el cruce de la línea rápida y la línea lenta
- Utiliza el indicador ADX (ciclo 14) para evaluar la intensidad de la tendencia, solo ingresa cuando el ADX es mayor a 25 para evitar el mercado de temblores
- Combinando el indicador RSI (ciclo 14) con el análisis de la dinámica, considere hacer más cuando el RSI está por debajo de 30 y considere hacer menos cuando está por encima de 70
- Introducción de análisis EMA en un marco de tiempo de 4 horas para aumentar la fiabilidad de los juicios de tendencias mediante la confirmación de múltiples marcos de tiempo
- Configuración de un stop loss dinámico, haciendo que el stop loss esté situado en el 5% del precio de entrada y el stop loss en el 2%; el pronóstico debe invertirse
Ventajas estratégicas
- Verificación cruzada de múltiples indicadores para mejorar significativamente la fiabilidad de la señal
- Dispone de un buen mecanismo de control de riesgos, incluido el stop loss dinámico y la gestión de posiciones basada en la volatilidad
- El análisis de múltiples marcos de tiempo reduce el riesgo de brechas falsas
- Alta tasa de ganancias y moderada tasa de pérdidas, con buenas expectativas de ganancias
- La lógica de la estrategia es clara, fácil de entender y mantener.
Riesgo estratégico
- Las fluctuaciones rápidas y violentas en el mercado pueden causar pérdidas de liquidez.
- Los mercados de volatilidad horizontal pueden generar transacciones frecuentes y aumentar los costos de las transacciones
- El EMA es un indicador retrasado que puede haber perdido el mejor momento de entrada
- Múltiples indicadores pueden generar señales contradictorias
- Las operaciones con un ciclo de 1 minuto tienen un alto requisito de velocidad de ejecución y pueden presentar un riesgo de deslizamiento
Dirección de optimización de la estrategia
- Optimización de los parámetros de suavización de ADX para mejorar la precisión de la identificación de tendencias
- Introducción de gestión de posiciones dinámicas basadas en ATR para adaptarse mejor a las fluctuaciones del mercado
- Aumente la dimensión del análisis de volumen y mejore la confiabilidad de la señal.
- Considerar la adición de clasificaciones de entornos de mercado, utilizando diferentes conjuntos de parámetros en diferentes condiciones de mercado
- Se puede intentar integrar algoritmos de aprendizaje automático para optimizar la selección de parámetros.
Resumir
La estrategia, a través de la sinergia de múltiples indicadores técnicos, construye un sólido sistema de seguimiento de tendencias. La estrategia, al tiempo que mantiene una alta tasa de éxito, logra considerables ganancias a través de un mecanismo de control de riesgo completo. Aunque hay cierto espacio para la optimización, el rendimiento general es satisfactorio, especialmente para los comerciantes que buscan ganancias estables.
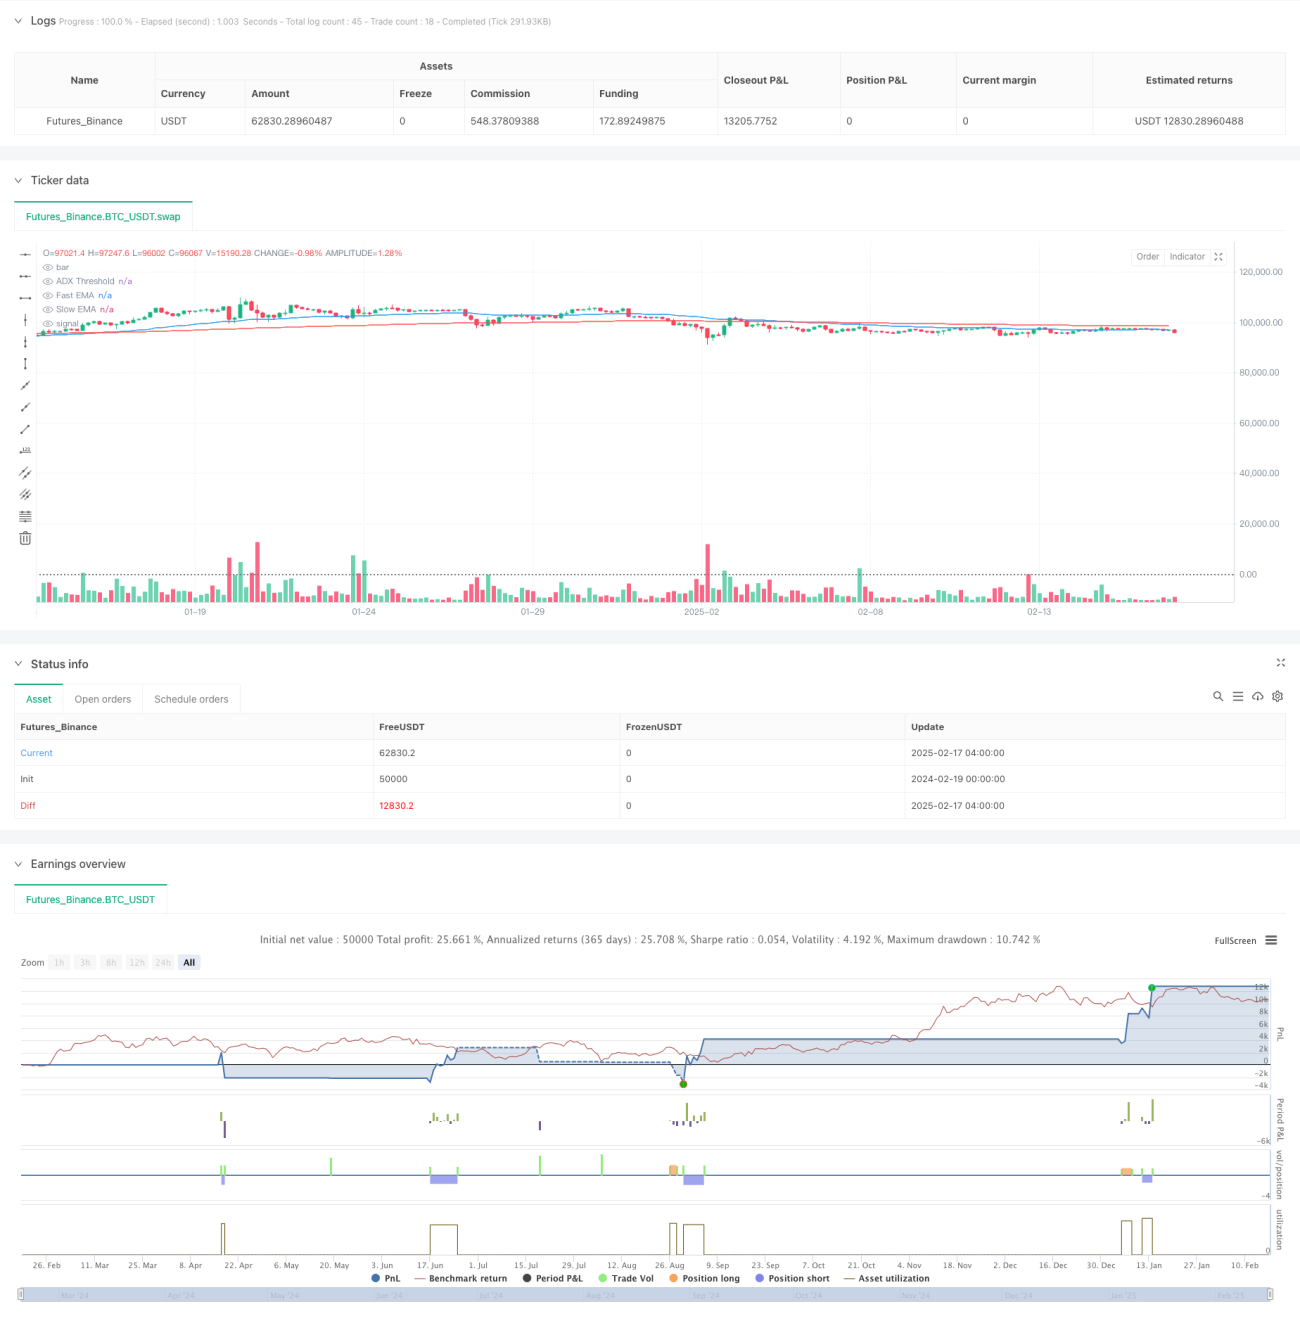
/*backtest
start: 2024-02-19 00:00:00
end: 2025-02-17 08:00:00
period: 4h
basePeriod: 4h
exchanges: [{"eid":"Futures_Binance","currency":"BTC_USDT"}]
*/

//@version=5
strategy("Enhanced Trend Following Strategy", overlay=true, default_qty_type=strategy.percent_of_equity, default_qty_value=200)

// === INPUTS ===- 1