Estrategia de trading de tendencia dinámica con dos indicadores: sistema de análisis técnico multidimensional basado en RSI y MACD
RSI MACD OB(Overbought) OS(Oversold) TA(Technical Analysis)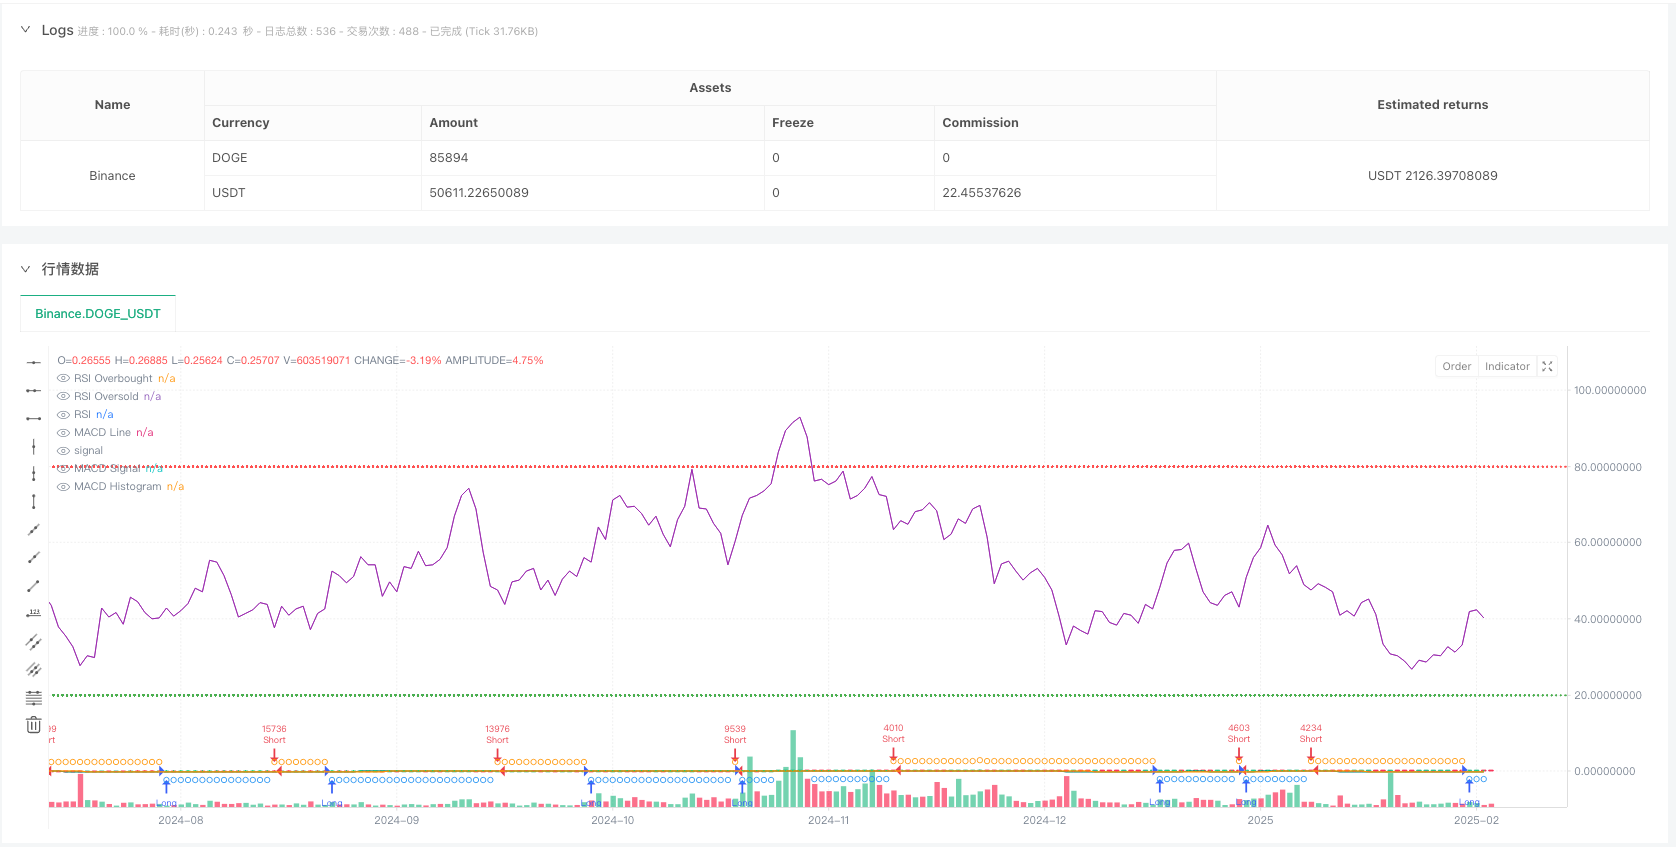
Descripción general
Esta es una estrategia de trading automática basada en indicadores de doble tecnología RSI y MACD. La estrategia identifica oportunidades de trading potenciales y logra una captura precisa del mercado mediante la combinación de señales de sobreventa y sobreventa con la confirmación de tendencias. La estrategia utiliza gestión de posición porcentual y un mecanismo de prevención de puntos de deslizamiento incorporado, con una gran practicidad y adaptabilidad.
Principio de estrategia
La lógica central de la estrategia se basa en los siguientes elementos clave:
- El indicador de fuerza relativa (RSI) se utiliza para determinar sobrecompra y sobreventa, con un parámetro de 14 ciclos, sobrecompra de 80 y sobreventa de 20
- El uso de MACD ((12, 26, 9) para la confirmación de tendencias, el cambio de tendencia a través de la identificación cruzada de la línea MACD con la línea de señal
- La generación de señales de negociación debe cumplir las condiciones de RSI y MACD:
- Hacer más condiciones: RSI no alcanza sobrecompra + línea MACD por encima de la línea de señal
- Condiciones de apertura: el RSI no alcanzó la venta por encima + la línea MACD debajo de la línea de señal
- Utiliza el 3% de los intereses de la cuenta como el tamaño de la posición por transacción y limita la reposición de la posición para transacciones simultáneas
Ventajas estratégicas
- La combinación de indicadores técnicos duales reduce considerablemente el riesgo de falsas señales y mejora la fiabilidad de las operaciones.
- La gestión de posiciones porcentual ayuda a ajustar el capital dinámicamente y a controlar mejor el riesgo
- El mecanismo anti-derrapante incorporado (de 3 puntos) mejora la adaptabilidad de la estrategia en el disco
- La estrategia apoya el uso de más operaciones binarias de descubierto para aprovechar las oportunidades del mercado
- Los períodos de negociación se pueden personalizar para adaptarse a las diferentes características del mercado
Riesgo estratégico
- El RSI y el MACD son indicadores retrasados que pueden no reaccionar a tiempo en un mercado de rápida volatilidad
- Los umbrales fijos de sobreventa y sobreventa pueden necesitar ajustes en diferentes entornos de mercado
- Las posiciones fijas del 3% pueden ser grandes o pequeñas en ciertos casos.
- No hay condiciones de parada de pérdidas establecidas, lo que puede provocar que las ganancias se vuelcan o que las pérdidas se amplíen
- Las condiciones estrictas de los binarios podrían perder algunas oportunidades de comercio potenciales
Dirección de optimización de la estrategia
- Introducción de los parámetros de ajuste del RSI, que se ajustan a la dinámica de las fluctuaciones del mercado para determinar el exceso de compra y venta
- Aumentar el mecanismo de parada de pérdidas, se recomienda establecer un punto de parada dinámico basado en el ATR o la volatilidad
- Optimizar el sistema de gestión de posiciones, considerando el ajuste dinámico del tamaño de las posiciones en función de la volatilidad del mercado y los cambios en el valor neto de las cuentas
- Añadir filtros de entornos de mercado para ajustar parámetros de estrategia o suspender operaciones en diferentes condiciones de mercado
- Considerar la introducción de indicadores de tráfico como confirmación auxiliar para mejorar la fiabilidad de la señal
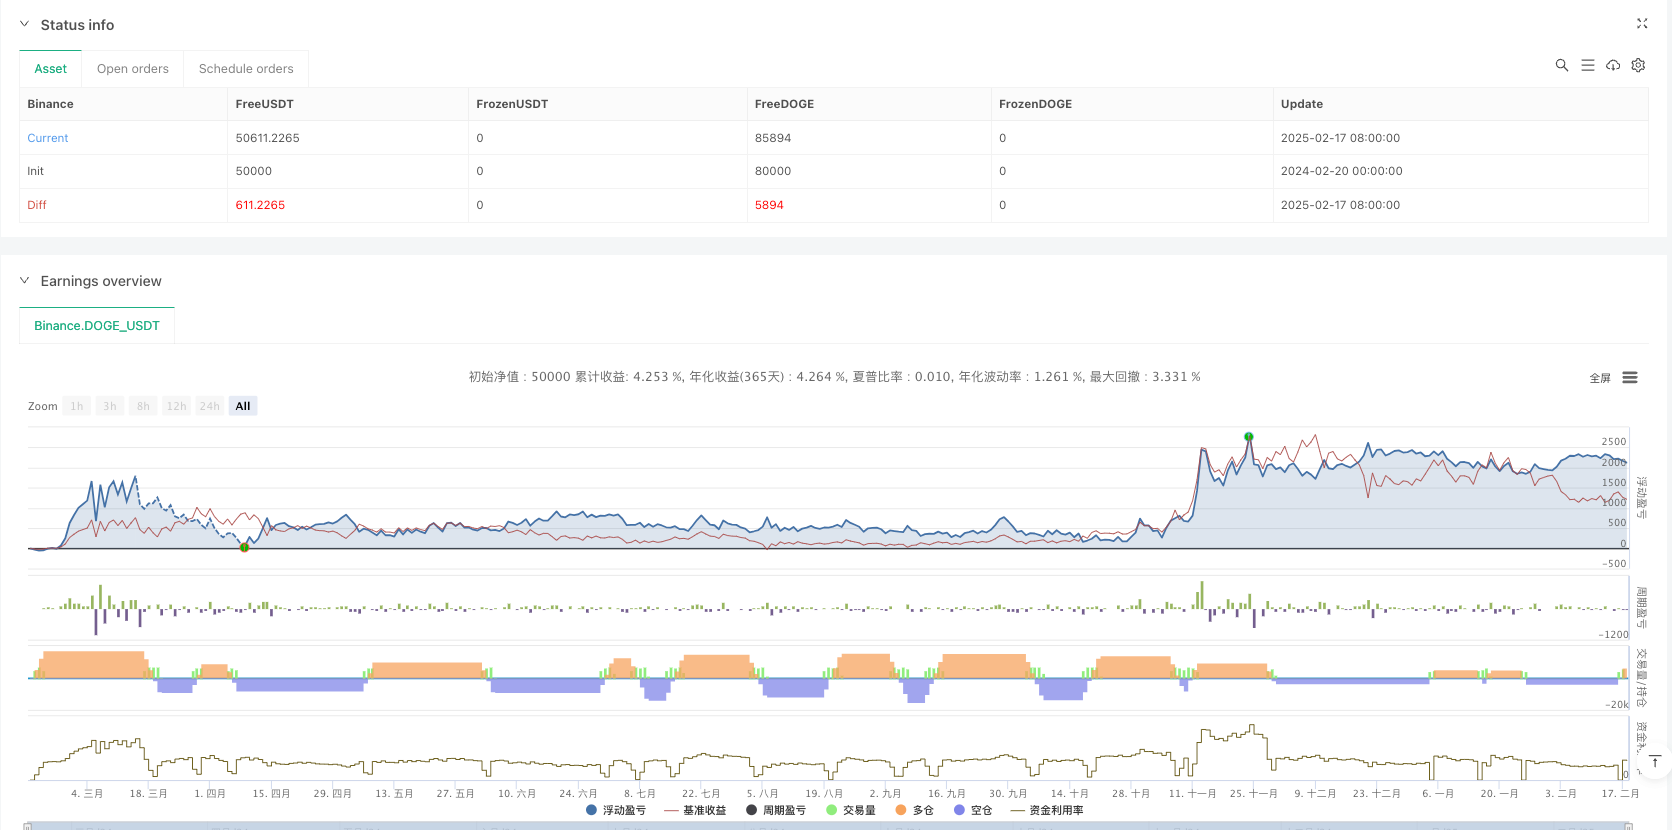
Resumir
La estrategia construye un sistema de negociación relativamente sólido a través de la sinergia entre el RSI y el MACD. Aunque existe un cierto riesgo de atraso, la estrategia sigue teniendo un buen valor práctico a través de un control razonable del riesgo y la optimización de los parámetros. Se recomienda realizar un buen retroceso antes de la aplicación en el mercado real y realizar una optimización específica según las características específicas del mercado.
//@version=6
strategy("Debugging Demo GPT",
         overlay=true,
         initial_capital=100,
         default_qty_type=strategy.percent_of_equity,
         default_qty_value=3,
         pyramiding=1,
         calc_on_order_fills=true,
         calc_on_every_tick=true,
         slippage=3)

// -----------------------------------------------------------------------
//   (1) Inputs: Start and End Date
// -----------------------------------------------------------------------


// -----------------------------------------------------------------------
//   (2) Indicators (RSI, MACD)
// -----------------------------------------------------------------------

// === RSI ===
rsiLen = input.int(14, "RSI Length")
rsiOB  = input.int(80, "RSI Overbought")
rsiOS  = input.int(20, "RSI Oversold")
rsiVal = ta.rsi(close, rsiLen)

// === MACD ===
fastLen  = input.int(12, "MACD Fast Length")
slowLen  = input.int(26, "MACD Slow Length")
sigLen   = input.int(9,  "MACD Signal Length")
[macdLine, sigLine, histLine] = ta.macd(close, fastLen, slowLen, sigLen)

// -----------------------------------------------------------------------
//   (3) Trading Logic: LONG/SHORT Filters
// -----------------------------------------------------------------------

bool rsiLongOk   = (rsiVal < rsiOB)
bool rsiShortOk  = (rsiVal > rsiOS)
bool macdLongOk  = (macdLine > sigLine)
bool macdShortOk = (macdLine < sigLine)

bool longCondition  = rsiLongOk and macdLongOk
bool shortCondition = rsiShortOk and macdShortOk

// -----------------------------------------------------------------------
//   (4) Entry Conditions
// -----------------------------------------------------------------------

// Debugging: Visualizing the conditions
plotshape(series=longCondition, location=location.belowbar, color=color.blue, style=shape.circle, title="LongCondition", size=size.tiny)
plotshape(series=shortCondition, location=location.abovebar, color=color.orange, style=shape.circle, title="ShortCondition", size=size.tiny)

// Entries only when all conditions are met
if longCondition
    strategy.entry("Long", strategy.long)
if shortCondition
    strategy.entry("Short", strategy.short)

// -----------------------------------------------------------------------
//   (5) Plotting for Visualization
// -----------------------------------------------------------------------

// RSI Plots
hline(rsiOB, "RSI Overbought", color=color.red, linestyle=hline.style_dotted)
hline(rsiOS, "RSI Oversold", color=color.green, linestyle=hline.style_dotted)
plot(rsiVal, title="RSI", color=color.purple)

// MACD Plots
plot(macdLine, color=color.teal, title="MACD Line")
plot(sigLine, color=color.orange, title="MACD Signal")
plot(histLine, style=plot.style_histogram, color=(histLine >= 0 ? color.lime : color.red), title="MACD Histogram")