Descripción general
La estrategia es un sistema de comercio de seguimiento de tendencias que combina múltiples indicadores técnicos. Se basa principalmente en señales cruzadas de promedios móviles simples (SMA) y promedios móviles indexados (EMA) e integra varias características avanzadas, como bandas de tendencia de promedios móviles de Hull (HMA), indicadores de William (%R) y análisis de puntos altos y bajos oscilantes, para proporcionar señales de comercio más confiables a través de un mecanismo de filtrado dinámico.
Principio de estrategia
La lógica central de la estrategia se basa en los siguientes elementos clave:
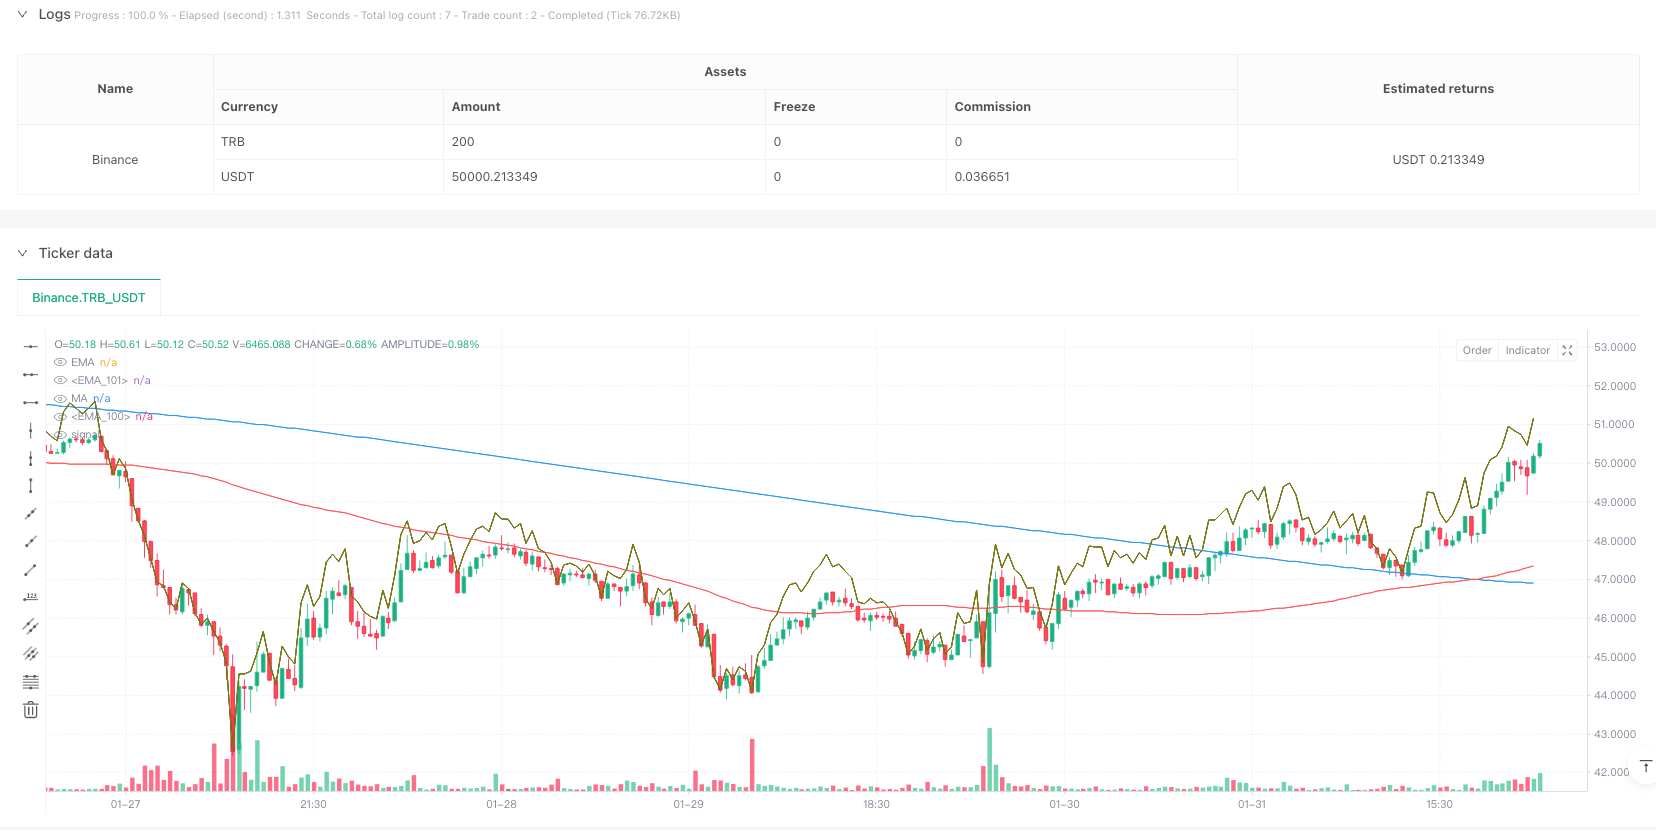
- Utiliza el SMA de 100 y el EMA de 200 como indicadores principales de tendencias
- Las bandas de tendencia HMA de 70 ciclos se utilizan para confirmar la dinámica de la tendencia
- Calculación del punto de soporte/resistencia dinámico con el indicador de William ((%R)
- Detección de la ventana de retroceso de 20 ciclos para detectar oscilaciones altas y bajas
- Monitoreo en tiempo real y actualizaciones
- Configuración de filtros iniciales de apertura y umbral de fluctuación (<0.5%) para reducir las señales falsas
Los requisitos de entrada deben cumplirse al mismo tiempo: doble línea media en la estación de precios, el indicador% R sube 3 líneas K consecutivas y es mayor que-20, la línea K se cierra y el precio de cierre es superior al anterior, el precio no supera el umbral de fluctuación diaria. Las condiciones de salida cumplen cualquiera de las siguientes condiciones: el precio cae por debajo de la línea media doble; el indicador %R es inferior a -80;
Ventajas estratégicas
- La validación sincronizada de múltiples indicadores técnicos mejora la fiabilidad de las señales de transacción
- El mecanismo de filtración dinámica reduce efectivamente las señales falsas en los períodos de gran oscilación
- El cálculo del soporte de resistencia auto-adaptado hace que la estrategia tenga una buena adaptabilidad al mercado
- Completo mecanismo de gestión de operaciones intradiarias, incluyendo filtración inicial de apertura y control de los límites de volatilidad
- Parámetros ajustables para una optimización de acuerdo con las diferentes condiciones del mercado
Riesgo estratégico
- El sistema de línea media puede generar falsas señales frecuentes en mercados convulsionados
- La selección de múltiples condiciones puede hacer que se pierdan algunas oportunidades de negocio potenciales
- El ciclo de las medias móviles fijas puede variar según el entorno del mercado
- El mecanismo de filtración de transacciones en el día puede perder una oportunidad importante en un contexto de tendencias rápidas
- La optimización excesiva de los parámetros puede causar problemas de sobreajuste
Dirección de optimización de la estrategia
- Introducción de un mecanismo de cálculo de ciclo medido lineal que se adapta a sí mismo para que el sistema se adapte mejor a las fluctuaciones del mercado
- Aumentar los indicadores de análisis de volumen de transacciones para mejorar la fiabilidad de la identificación de tendencias
- Desarrollo de mecanismos dinámicos de detención de pérdidas y mejora de la eficiencia de la gestión de fondos
- Ajuste de los parámetros de fluctuación del mercado para optimizar las condiciones de filtración
- Consideración de la sinergia de señales en diferentes períodos de tiempo para mejorar la estabilidad del sistema
Resumir
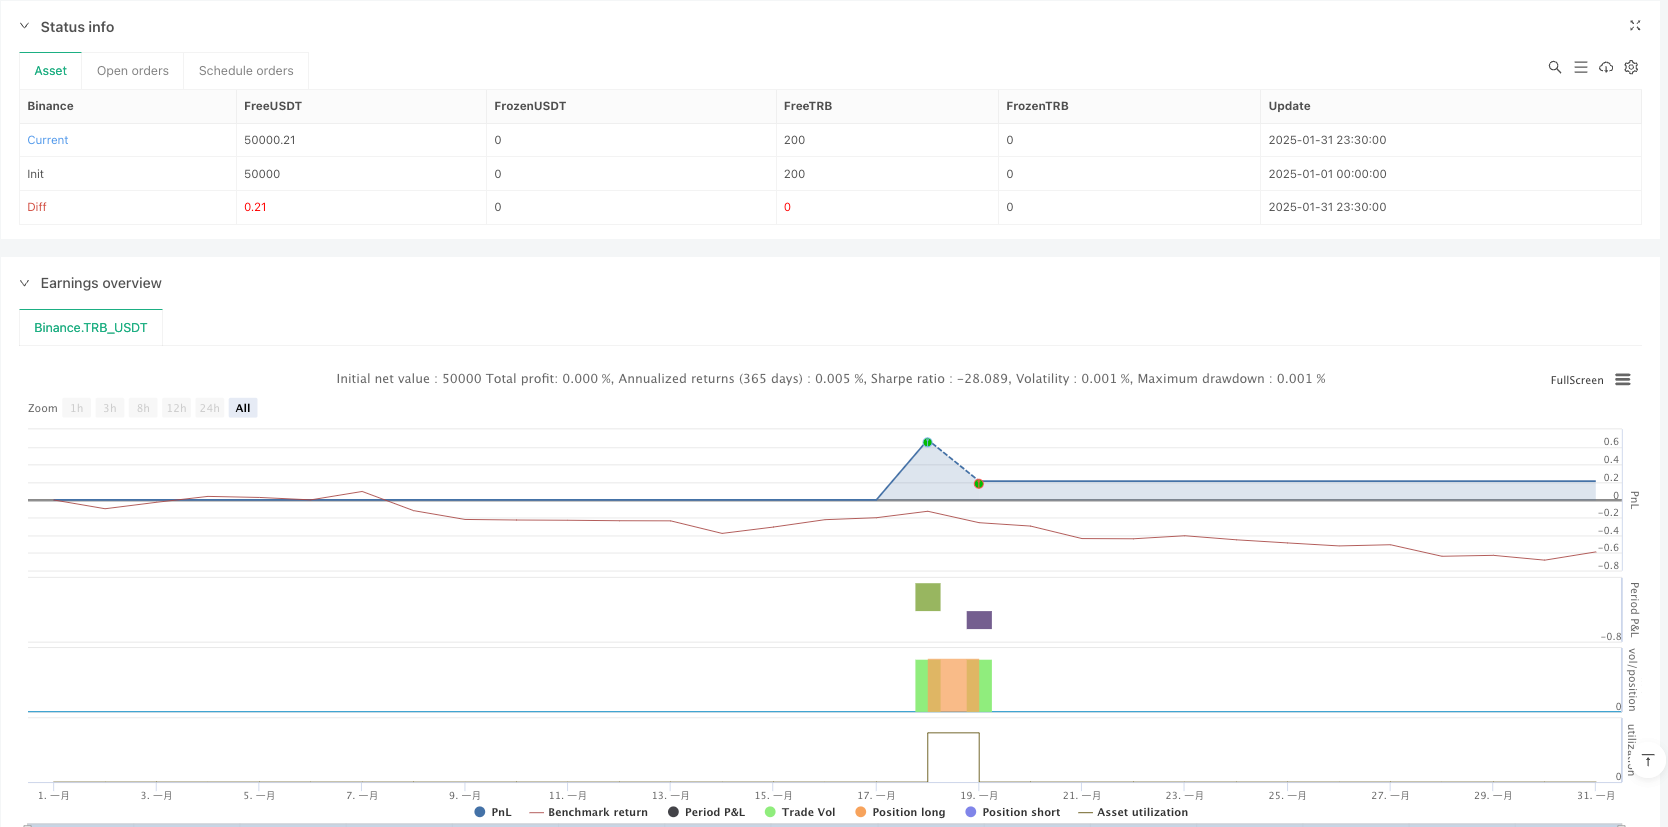
Se trata de un sistema de comercio de seguimiento de tendencias bien diseñado, que mantiene una buena flexibilidad al tiempo que garantiza la fiabilidad mediante la combinación de múltiples indicadores técnicos y un mecanismo de filtrado estricto. El espacio de optimización de la estrategia se basa principalmente en la adaptabilidad de los parámetros y la mejora del mecanismo de gestión de riesgos. Se recomienda a los operadores que, antes de su uso en el mercado, prueben su rendimiento en diferentes entornos de mercado y ajusten la configuración de los parámetros según las circunstancias.
/*backtest
start: 2025-01-01 00:00:00
end: 2025-01-31 23:59:59
period: 30m
basePeriod: 30m
exchanges: [{"eid":"Binance","currency":"TRB_USDT"}]
*/

//@version=5
strategy(title="EMA & MA Crossover Strategy", shorttitle="EMA & MA Crossover Strategy", overlay=true)

// Inputs
LengthMA = input.int(100, minval=1, title="MA Length")
LengthEMA = input.int(200, minval=1, title="EMA Length")
swingLookback = input.int(20, title="Swing Lookback")
Lengthhmaribbon = input.int(70, minval=1, title="HMA Ribbon")
// Input for ignoring the first `n` candles of the day
ignore_n_candles = input.int(1, "Ignore First N Candles", minval=0)
// Input for percentage threshold to ignore high run-up candles
run_up_threshold = input.float(0.5, "Run-up Threshold (%)", minval=0.0)

//====================================================================
hmacondition = ta.hma(close,Lengthhmaribbon)> ta.hma(close,Lengthhmaribbon)[1]

//====================================================================
// Function to drop the first `n` candles
dropn(src, n) =>
    na(src[n]) ? na : src

// Request data with the first `n` candles dropped
valid_candle = not na(dropn(close, ignore_n_candles))
// Check for run-up condition on the previous candle
prev_run_up = (high[1] - low[1]) / low[1] * 100

// Combine conditions: exclude invalid candles and ignore high run-up candles
valid_entry_condition = valid_candle and prev_run_up <= run_up_threshold

//======================================================
// Define the start of a new day based on time
var is_first = false
var float day_high = na
var float day_low = na

// Use time() to detect the start of a new day
t = time("1440") // 1440 = 60 * 24 (one full day in minutes)
is_first := na(t[1]) and not na(t) or t[1] < t

if is_first and barstate.isnew
    day_high := high
    day_low := low
else
    day_high := nz(day_high[1], high)
    day_low := nz(day_low[1], low)

// Update daily high and low
if high > day_high
    day_high := high

if low < day_low
    day_low := low

//====================================================
previousdayclose = request.security(syminfo.tickerid, "D", close)

day_highrange = previousdayclose*.018
//======================================================
length = input(title="Length", defval=14)
src = input(close, "Source")
_pr(length) =>
	max = ta.highest(length)
	min = ta.lowest(length)
	100 * (src - max) / (max - min)
percentR = _pr(length)

//======================================================
higherline = close* 1+((100-(percentR*-1))/100)
lowerline = close* 1-((100-(percentR*-1))/100)
//======================================================
// Moving Averages
xMA = ta.sma(close, LengthMA)
xEMA = ta.sma(xMA, LengthEMA)

// Plot the MA and EMA lines
plot(xMA, color=color.red, title="MA")
plot(xEMA, color=color.blue, title="EMA")

// Find recent swing high and low
recentHigh = ta.highest(high, swingLookback)
recentLow = ta.lowest(low, swingLookback)
//===============================================
emacondition = ta.ema(close,20)>ta.ema(close,30) and ta.ema(close,30)>ta.ema(close,40) and ta.ema(close,40)>ta.ema(close,50) and close >ta.ema(close,20)
// Define Buy Condition
buyCondition1 = (percentR>percentR[1] and percentR[1]>percentR[2] and percentR[2]>percentR[3]) and percentR>-20 and percentR[1]>-20
buyCondition = (close> xMA and close> xEMA) and (close > open and close > close[1]) or xMA>xEMA and close<day_highrange and hmacondition and emacondition

// Define Sell Conditions
sellCondition = (close < xMA and close < xEMA) or xMA<xEMA or percentR<-80

// Strategy Execution
if (buyCondition and buyCondition1 and valid_entry_condition)
    strategy.entry("Buy", strategy.long)

if (sellCondition)
    strategy.close("Buy")  // Close the long position

// Candle coloring for buy/sell indication
barcolor(buyCondition ? color.green : sellCondition ? color.red : na)
plot(higherline, color=color.olive, title="EMA")
plot(higherline, color=color.black, title="EMA")