Estrategia avanzada de inversión de impulso con media móvil dual: sistema de negociación colaborativa con RSI y bandas de Bollinger

Descripción general
La estrategia es un sistema de trading de análisis técnico avanzado que combina indicadores relativamente débiles (RSI) y la banda de Brin (BB). Utilizando ambos indicadores de manera sincronizada, busca oportunidades de inversión de alta probabilidad en áreas de sobreventa y sobreventa en el mercado. La estrategia utiliza una media móvil de 20 períodos como línea de referencia para la banda de Brin, que se pone en marcha a un descenso de dos veces la diferencia estándar, mientras que el análisis de dinámica utiliza el RSI de 14 períodos y genera una señal de negociación cuando el RSI supera el 30/70 y el precio toca el límite de la banda de Brin.
Principio de estrategia
La lógica central de la estrategia se basa en la interacción de dos indicadores técnicos principales:
- El segmento de la banda de Bryn utiliza una media móvil simple de 20 ciclos como trayectoria media, y las trayectorias superiores y inferiores se multiplican por 2 veces la diferencia estándar para identificar el rango de fluctuación de los precios.
- El RSI utiliza una configuración de 14 ciclos, con 30 como nivel de sobreventa y 70 como nivel de sobreventa, para determinar el estado de la dinámica del mercado.
- Se requiere que se cumplan varias condiciones al mismo tiempo: el RSI ha superado los 30 y el precio ha tocado o está por debajo de la línea de descenso de Brin.
- Las condiciones para hacer aire deben cumplirse al mismo tiempo: RSI a la baja de 70 y el precio toca o está por encima de la banda de Brin.
- Las condiciones de posición baja incluyen: RSI que rompe el extremo inverso o el precio que rompe el centro de la banda de Brin.
Ventajas estratégicas
- Mecanismo de doble confirmación: proporciona una señal de negociación más confiable a través del uso de la combinación de RSI y Brinband.
- Adaptabilidad: Las bandas de Brin se ajustan automáticamente a las fluctuaciones del mercado para adaptarse a las diferentes condiciones del mercado.
- Control de riesgos: Condiciones de entrada y salida claras para evitar el exceso de operaciones.
- Las estrategias ofrecen una clara indicación visual que ayuda a los traders a entender el estado del mercado.
- Ajustabilidad de los parámetros: los parámetros clave se pueden optimizar según las diferentes características del mercado.
Riesgo estratégico
- Riesgo de mercado convulsivo: Falsa brecha frecuente en el mercado horizontal.
- Riesgo de mercado de tendencia: en una fuerte tendencia, las señales de reversión pueden conducir a una liquidación prematura.
- Sensibilidad a los parámetros: diferentes entornos de mercado pueden requerir diferentes configuraciones de parámetros.
- Riesgo de deslizamiento: En mercados con poca liquidez, el precio de transacción real puede estar desviado del precio de la señal.
- Riesgo sistémico: el riesgo de retroceder en un mercado con una gran volatilidad.
Dirección de optimización de la estrategia
- Aumentar el filtro de tendencia: Introducir indicadores de tendencia adicionales para evitar inversiones en una tendencia fuerte.
- Adaptación de los parámetros de optimización: desarrollo de mecanismos de ajuste de parámetros dinámicos para que las estrategias se adapten mejor a los cambios en el mercado.
- Mejorar la gestión de riesgos: añadir un sistema dinámico de objetivos de pérdidas y ganancias
- Aumentar el análisis de volumen de transacciones: la combinación de indicadores de volumen de transacciones mejora la fiabilidad de la señal.
- Identificar el entorno de desarrollo del mercado: establecer un sistema de clasificación del estado del mercado que utilice diferentes parámetros en diferentes condiciones del mercado.
Resumir
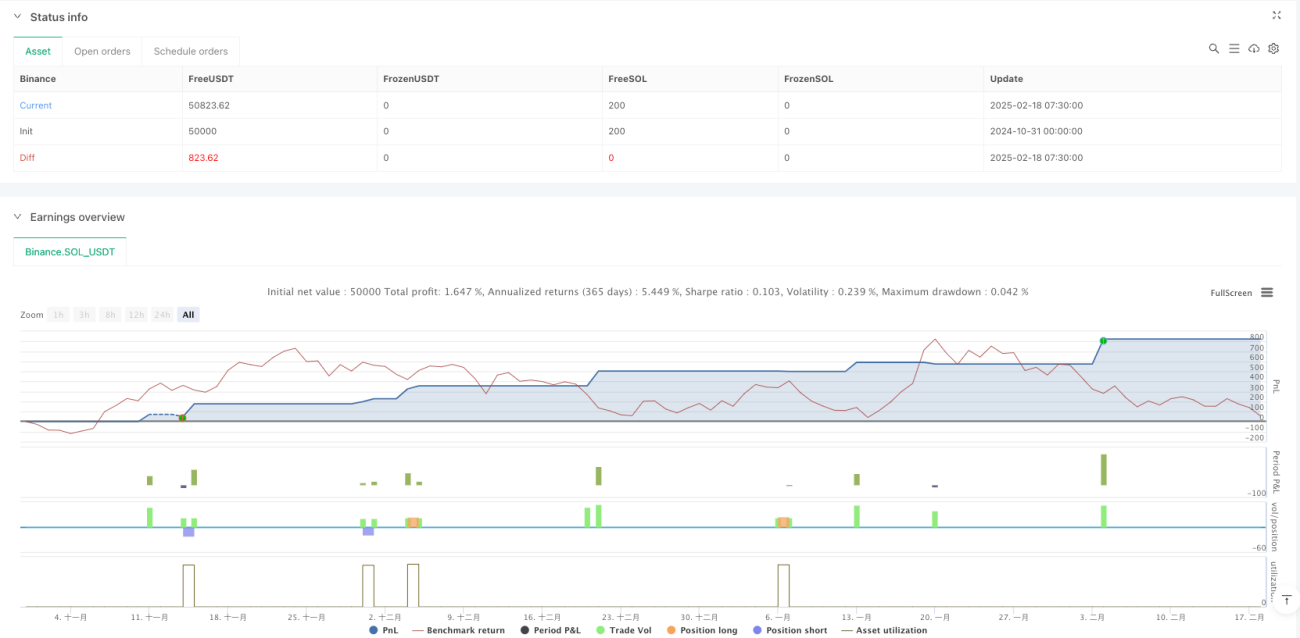
La estrategia construye un sistema de negociación completo a través de la sinergia entre el RSI y el Brinbelt. No solo ofrece señales de entrada y salida claras, sino que también tiene un buen mecanismo de control de riesgo. Aunque existen algunos riesgos inherentes, la estrategia espera mantener un rendimiento estable en diferentes entornos de mercado a través de la optimización y el perfeccionamiento continuos.
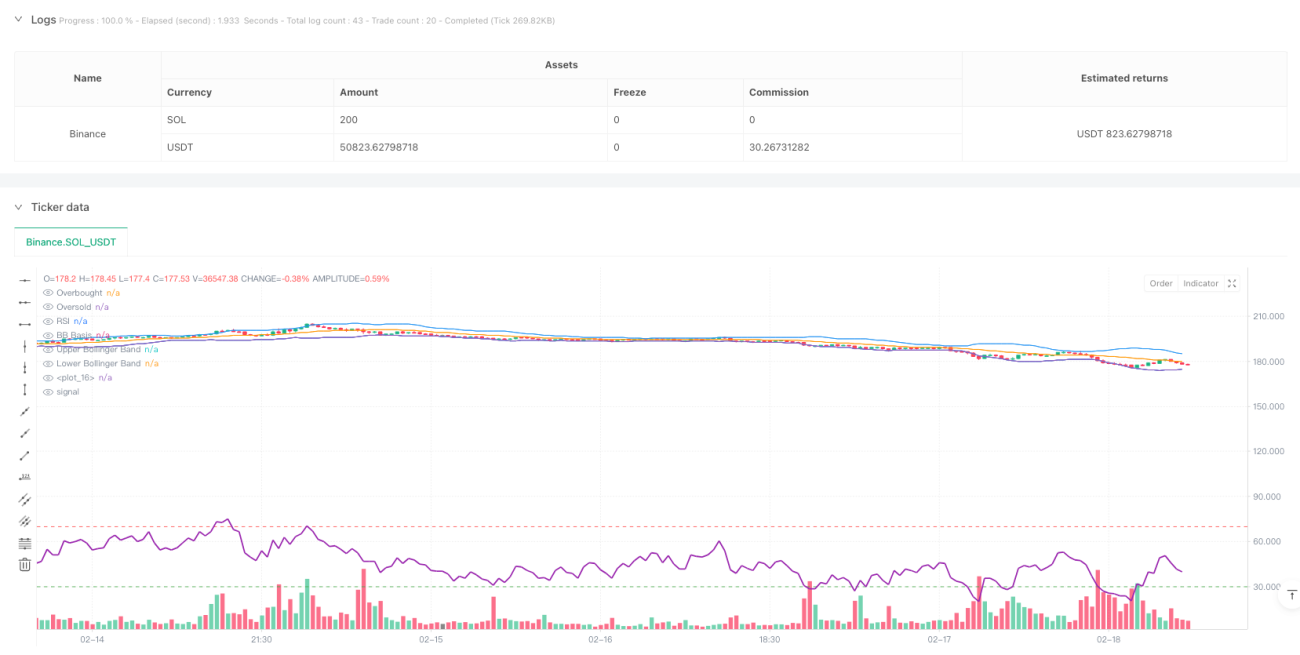
/*backtest
start: 2024-10-31 00:00:00
end: 2025-02-18 08:00:00
period: 30m
basePeriod: 30m
exchanges: [{"eid":"Binance","currency":"SOL_USDT"}]
*/

//@version=5
strategy("RSI + Bollinger Bands Strategy", overlay=true, default_qty_type=strategy.percent_of_equity, default_qty_value=10)

// Bollinger Bands Settings- 1