Descripción general
La estrategia es un sistema de negociación integral basado en análisis técnico, que combina el análisis de las áreas de resistencia de soporte, la configuración del gráfico y la estructura del mercado. La estrategia toma decisiones de negociación mediante la identificación de niveles de precios clave, la confirmación de señales gráficas y la evaluación de las tendencias generales del mercado.
Principio de estrategia
La lógica central de la estrategia se basa en los siguientes componentes clave:
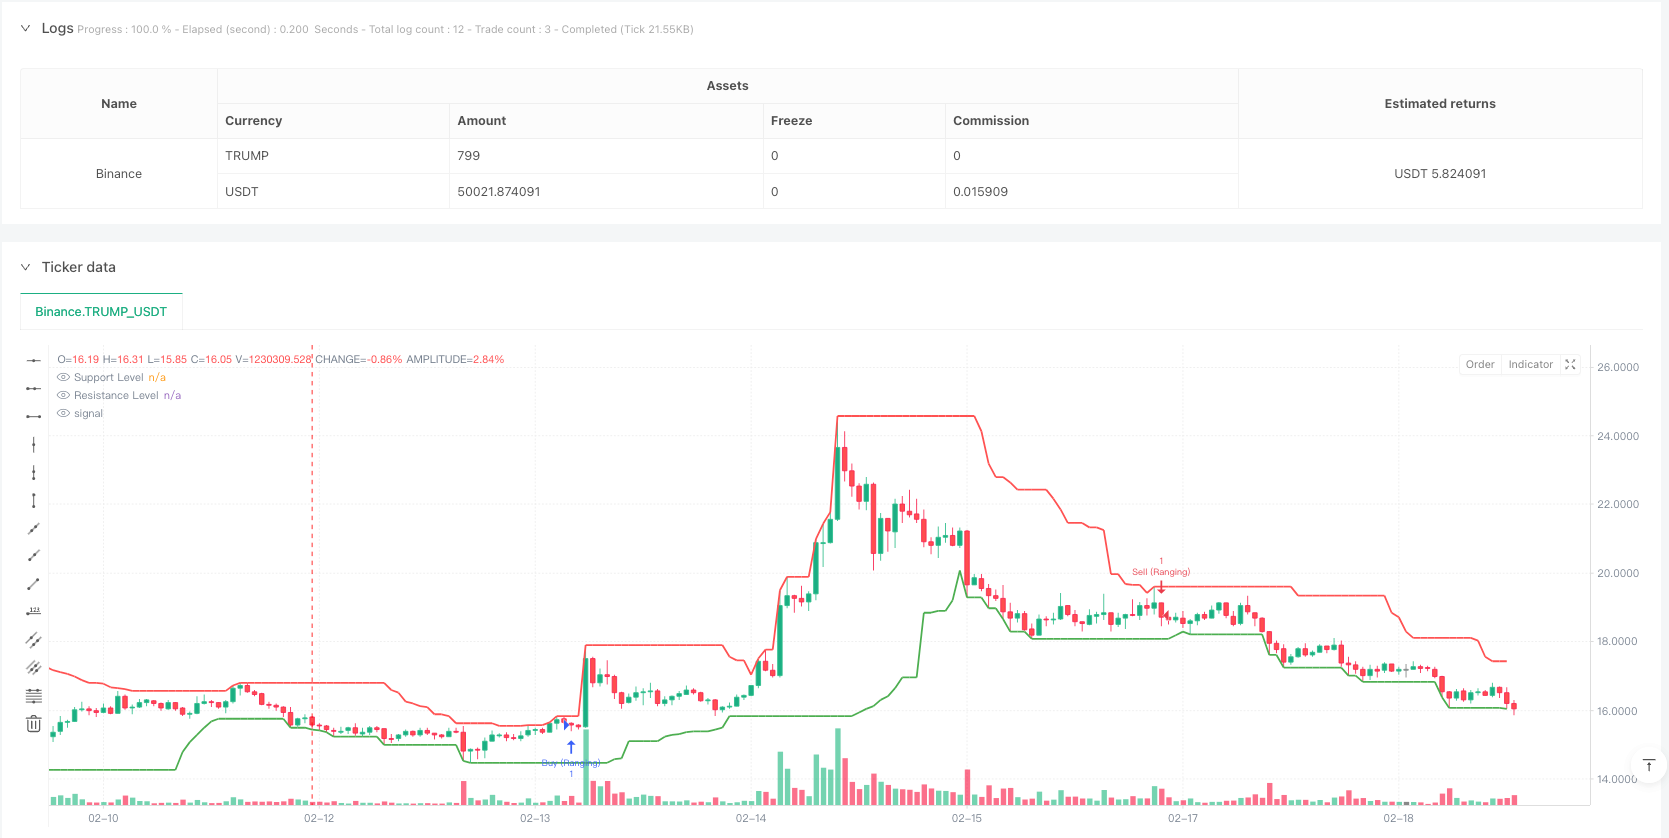
- Identificación de las áreas de soporte y resistencia - Utiliza los máximos y mínimos de los últimos 20 ciclos para determinar los niveles de precios clave
- Confirmación de las formas del mapa - incluidas las formas típicas como la absorción de las cuentas, la absorción de las cuentas, las líneas de cubo y las líneas de meteoros
- Análisis de la estructura del mercado - para determinar si el mercado está en una tendencia ascendente, una tendencia descendente o una oscilación intermedia mediante la comparación de una serie de puntos altos y bajos
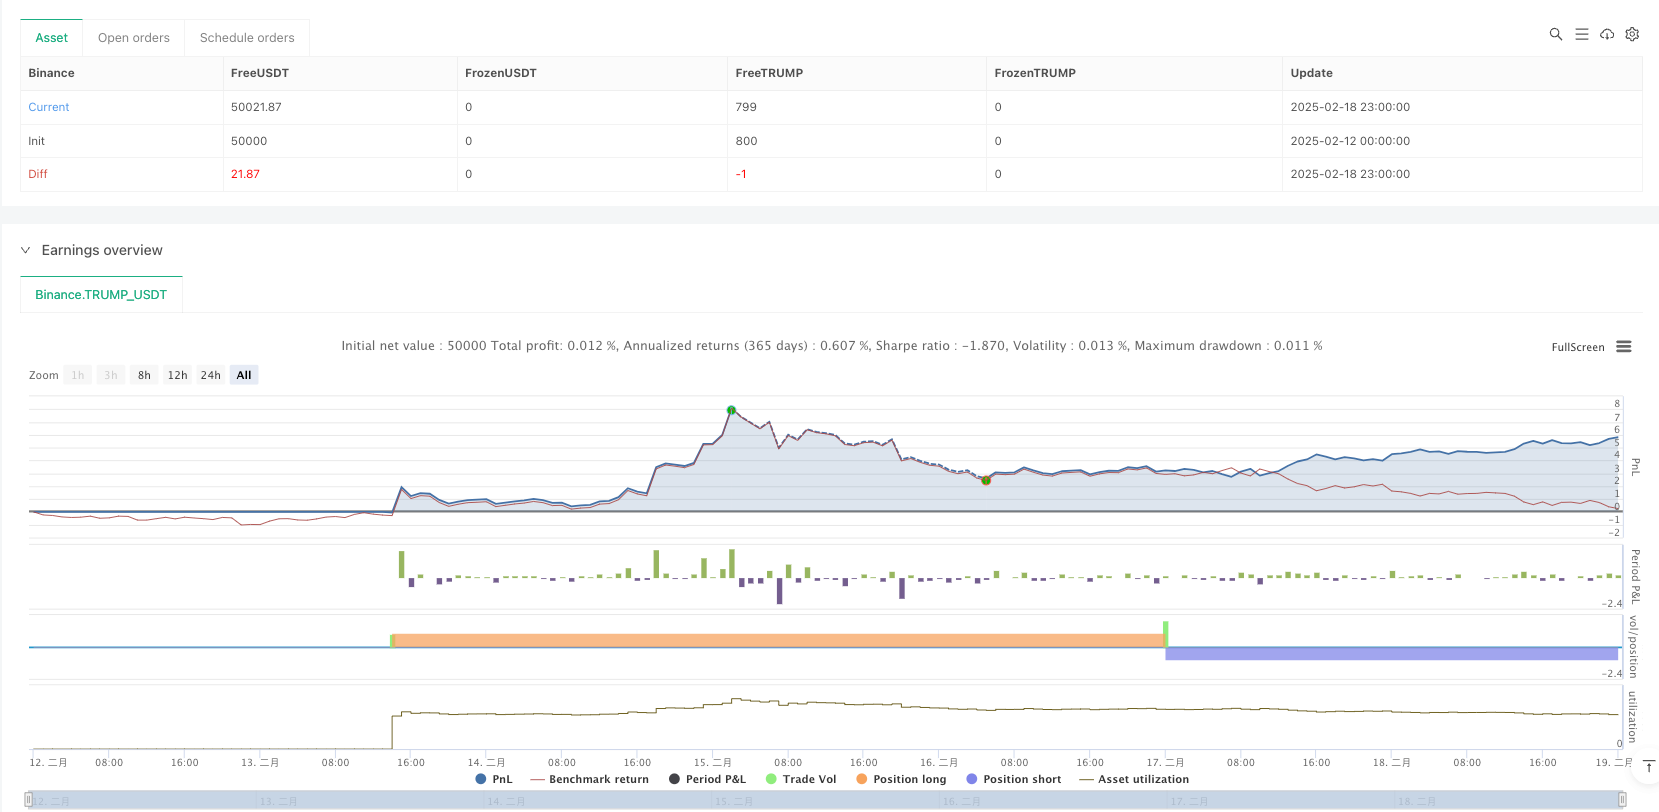
- Gestión de riesgos - establezca una posición de parada con un número fijo de puntos de parada y una relación de riesgo-beneficio de 1:3
La estrategia funciona en tres tipos de entornos de mercado: el mercado de tendencia, el mercado intermedio y el mercado de giro, pero se utiliza una combinación diferente de reglas de negociación para cada tipo de entorno.
Ventajas estratégicas
- Análisis multidimensional - proporciona señales de negociación más confiables mediante la integración de niveles de precios, patrones gráficos y estructura de mercado
- Adaptabilidad - capacidad de adaptarse a diferentes entornos del mercado, incluidas tendencias y intervalos
- Gestión de riesgos perfecta: proporción de riesgo-beneficio fija para garantizar que cada operación tenga un control claro del riesgo
- Soporte visual - Las zonas de resistencia son apoyadas por marcas gráficas para ayudar a los operadores a entender el estado del mercado
Riesgo estratégico
- Riesgo de brecha falsa - El precio puede retroceder rápidamente después de la ruptura, generando una falsa señal
- Riesgo de deslizamiento - los precios de transacción reales pueden estar muy alejados de las expectativas en períodos de gran volatilidad
- Sensibilidad de los parámetros - la elección de los parámetros de soporte, como el ciclo de resistencia, el ciclo de la estructura del mercado, puede afectar significativamente el rendimiento de la estrategia
- Dependencia del entorno del mercado - puede tener un mal desempeño en un mercado de movimiento rápido y unidireccional o de gran volatilidad
Dirección de optimización de la estrategia
- Ajuste de parámetros dinámicos - ciclo de cálculo de las zonas de resistencia de soporte que se ajustan automáticamente a la volatilidad del mercado
- Mejora del filtro - añade indicadores como el volumen de tráfico, la fluctuación para filtrar falsas señales de ruptura
- Optimización de la parada de pérdidas - Implementación de una configuración de parada de pérdidas dinámica basada en el ATR para una mayor adaptabilidad a las fluctuaciones del mercado
- Verificación de marco horario - Introducción de análisis de múltiples marcos horarios para mejorar la fiabilidad de la señal
- Optimización de la gestión de posiciones - ajuste dinámico del tamaño de las posiciones en función de la volatilidad del mercado y la intensidad de las señales
Resumir
La estrategia se basa en la integración de varias herramientas de análisis técnico para construir un sistema de negociación completo. Sus ventajas son el análisis multidimensional y la gestión de riesgos, pero también se enfrentan a desafíos como los falsos avances y la sensibilidad de los parámetros.
/*backtest
start: 2025-02-12 00:00:00
end: 2025-02-19 00:00:00
period: 1h
basePeriod: 1h
exchanges: [{"eid":"Binance","currency":"TRUMP_USDT"}]
*/

//@version=5
strategy("Support/Resistance Strategy with Candlestick Confirmation, Market Structure, and 1:3 R:R", overlay=true)

// Input parameters
supportResistancePeriod = input.int(20, title="Support/Resistance Period", minval=1)
stopLossPips = input.int(50, title="Stop Loss (in pips)", minval=1)
takeProfitRatio = input.float(3.0, title="Risk-to-Reward Ratio", minval=1.0)
structurePeriod = input.int(20, title="Market Structure Period", minval=1)  // Period to determine market structure

// Function to calculate support level (lowest low in the period)
getSupportLevel() =>
    ta.lowest(low, supportResistancePeriod)

// Function to calculate resistance level (highest high in the period)
getResistanceLevel() =>
    ta.highest(high, supportResistancePeriod)

// Get the support and resistance levels
supportLevel = getSupportLevel()
resistanceLevel = getResistanceLevel()

// Function to detect market structure
isBullishTrend() =>
    high[structurePeriod] > high[structurePeriod+1] and low[structurePeriod] > low[structurePeriod+1]

isBearishTrend() =>
    high[structurePeriod] < high[structurePeriod+1] and low[structurePeriod] < low[structurePeriod+1]

isRanging() =>
    not isBullishTrend() and not isBearishTrend()

// Candlestick Pattern Detection Functions
isBullishEngulfing() =>
    close[1] < open[1] and close > open and close > open[1] and open < close[1]

isBearishEngulfing() =>
    close[1] > open[1] and close < open and close < open[1] and open > close[1]

isDoji() =>
    math.abs(close - open) <= (high - low) * 0.1

isHammer() =>
    body = math.abs(close - open)
    upperShadow = high - math.max(close, open)
    lowerShadow = math.min(close, open) - low
    body <= (high - low) * 0.3 and lowerShadow > body * 2 and upperShadow <= body * 0.5

isShootingStar() =>
    body = math.abs(close - open)
    upperShadow = high - math.max(close, open)
    lowerShadow = math.min(close, open) - low
    body <= (high - low) * 0.3 and upperShadow > body * 2 and lowerShadow <= body * 0.5

// Conditions for Buy and Sell based on candle close
buyCondition = (isBullishEngulfing() or isHammer()) and close > supportLevel
sellCondition = (isBearishEngulfing() or isShootingStar()) and close < resistanceLevel

// Define buy/sell conditions based on market structure
bullishMarket = isBullishTrend() and buyCondition
bearishMarket = isBearishTrend() and sellCondition
rangingMarket = isRanging() and (buyCondition or sellCondition)

// Calculate the Stop Loss and Take Profit Levels
longStopLoss = supportLevel - (stopLossPips * syminfo.mintick)
shortStopLoss = resistanceLevel + (stopLossPips * syminfo.mintick)

// Calculate R:R based Take Profit Levels
longTakeProfit = close + (math.abs(close - longStopLoss) * takeProfitRatio)
shortTakeProfit = close - (math.abs(close - shortStopLoss) * takeProfitRatio)

// Plotting Support and Resistance Lines
plot(supportLevel, color=color.green, linewidth=2, title="Support Level", style=plot.style_line)
plot(resistanceLevel, color=color.red, linewidth=2, title="Resistance Level", style=plot.style_line)

// Strategy: Buy on Support, Sell on Resistance with candlestick confirmation and market structure
if (bullishMarket)
    strategy.entry("Buy", strategy.long, stop=longStopLoss, limit=longTakeProfit)

if (bearishMarket)
    strategy.entry("Sell", strategy.short, stop=shortStopLoss, limit=shortTakeProfit)

if (rangingMarket)
    if (buyCondition)
        strategy.entry("Buy (Ranging)", strategy.long, stop=longStopLoss, limit=longTakeProfit)
    if (sellCondition)
        strategy.entry("Sell (Ranging)", strategy.short, stop=shortStopLoss, limit=shortTakeProfit)

// Optional: Highlighting the zones for support and resistance
bgcolor(close > resistanceLevel ? color.new(color.red, 90) : na, title="Resistance Zone")
bgcolor(close < supportLevel ? color.new(color.green, 90) : na, title="Support Zone")