
Descripción general
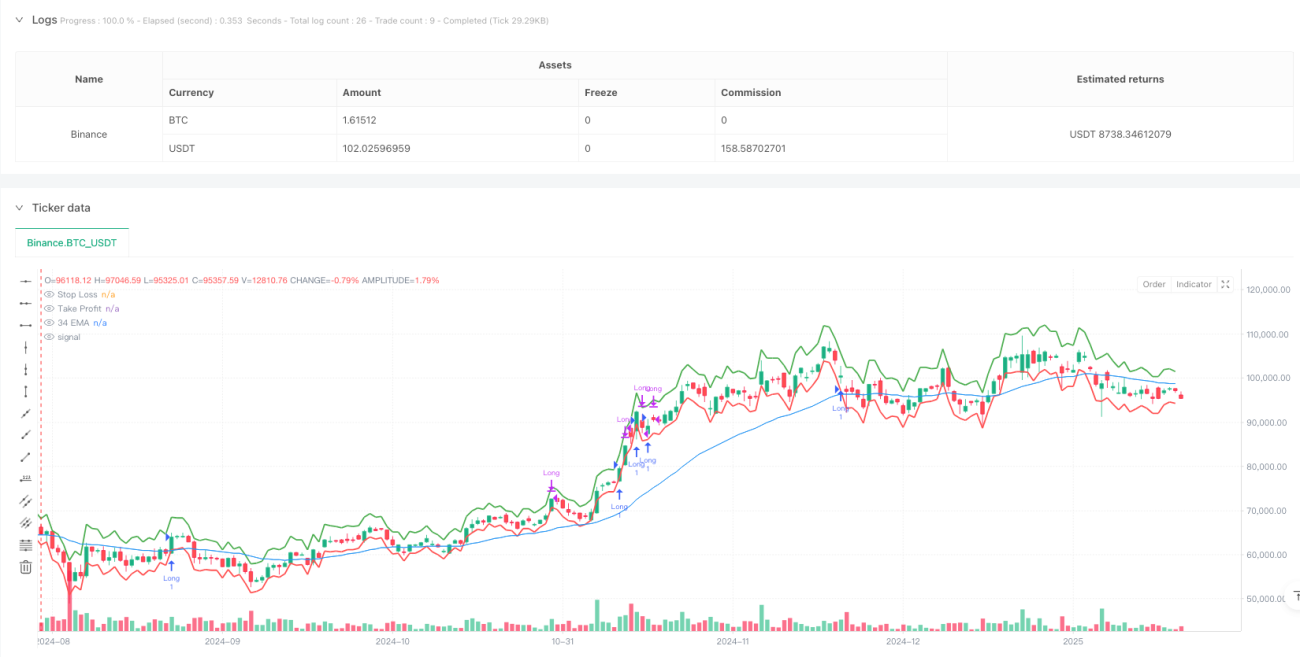
La estrategia es un sistema de negociación que combina el seguimiento de la tendencia y la inversión de la dinámica. Se basa principalmente en el promedio de la EMA de 34 períodos para juzgar la tendencia general, identificando las zonas de sobreventa y sobreventa a través del indicador RSI, mientras que se combina con la forma de la línea K y la señal de confirmación de transacciones de la transacción. La estrategia adopta un método dinámico de stop loss y ganancias basado en ATR, que puede ajustar los parámetros de negociación de acuerdo con la volatilidad del mercado.
Principio de estrategia
La lógica central de la estrategia incluye los siguientes elementos clave:
- Determinación de tendencias: Utiliza el EMA de 34 ciclos como indicador de tendencias principal y busca más oportunidades solo cuando el precio está por encima del EMA
- Condiciones de ingreso: Se requiere la combinación de líneas K "Yin-Yang-Yang", es decir, una línea yin seguida de dos líneas yang
- Confirmación de la dinámica: Confirmación de la dinámica con el indicador RSI, que requiere un valor RSI mayor a 50 para indicar energía de fluctuación hacia arriba
- Filtración de transacciones: requiere que el volumen de transacciones actuales sea mayor que el promedio de transacciones de 20 ciclos para asegurar una participación suficiente en el mercado
- Gestión de riesgos: Utiliza 1.5 veces el ATR como objetivo de ganancias y 1 vez el ATR como posición de stop loss
Ventajas estratégicas
- Confirmación de múltiples señales: la confirmación de transacciones en varias dimensiones, combinando tendencias, formas, dinámicas y volúmenes de transacciones, puede reducir eficazmente las señales falsas
- Gestión de riesgos dinámica: configuración de pérdidas y ganancias basada en el ATR que se ajusta automáticamente a la volatilidad del mercado
- Características de seguimiento de tendencias: Asegurar el comercio en la dirección de la tendencia principal a través de EMA para aumentar las probabilidades de éxito
- Ajustes de parámetros flexibles: los parámetros clave, como el ciclo EMA, el mínimo RSI y el múltiplo ATR, se pueden ajustar para adaptarse a diferentes entornos del mercado
Riesgo estratégico
- Riesgo de reversión de la tendencia: pérdidas continuas en el punto de inflexión de la tendencia
- Riesgo de falsa ruptura: la forma de la línea K puede producir falsa ruptura, lo que lleva a una señal errónea
- Riesgo de fluctuaciones en el mercado: los valores de ATR pueden aumentar de forma anormal durante períodos de gran volatilidad, lo que puede afectar a los parámetros de pérdidas
- Sensibilidad de parámetros: los parámetros óptimos pueden variar mucho en diferentes entornos de mercado
Dirección de optimización de la estrategia
- Añadir un filtro de intensidad de tendencia: se puede introducir un indicador ADX para medir la intensidad de la tendencia y solo negociar en una tendencia fuerte
- Mecanismo de salida mejorado: se puede agregar el stop móvil para proteger tanto los beneficios como los beneficios
- Optimización de los indicadores de volumen de negocios: Considere el uso de indicadores de volumen de negocios o de volumen de negocios
- Aumentar el filtro de tiempo: se puede agregar una ventana de tiempo de negociación para evitar períodos de mayor volatilidad
- Introducción de la clasificación de las condiciones del mercado: ajuste de los parámetros de la estrategia en función de las diferentes condiciones del mercado
Resumir
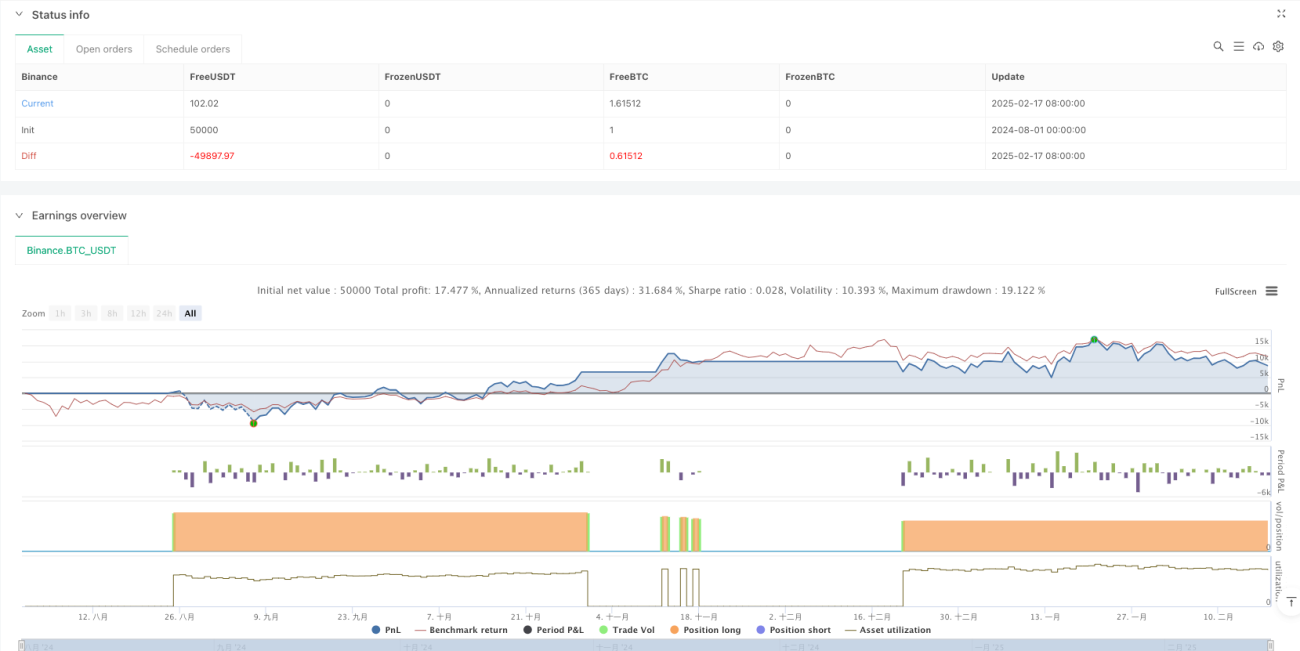
La estrategia, mediante la combinación de varios indicadores técnicos, construye un sistema de negociación completo, con una buena adaptabilidad y escalabilidad. La estrategia tiene como ventaja central la confirmación de señales multidimensional y la gestión dinámica del riesgo, pero también debe tener en cuenta la optimización de los parámetros y la adaptabilidad al entorno del mercado.
- 1