
Descripción general
La estrategia es un sistema de negociación que combina señales de cruce de doble equilátero y gestión de riesgo dinámico. La estrategia genera señales de negociación a través de cruces de promedios móviles a corto y largo plazo, mientras que utiliza el indicador ATR para ajustar dinámicamente los puntos de parada y ventaja, e introduce filtros de tiempo y períodos de enfriamiento para optimizar la calidad de la negociación. La estrategia también incluye un mecanismo de gestión de la relación de riesgo-beneficio y el porcentaje de riesgo por transacción.
Principio de estrategia
La estrategia se basa en los siguientes componentes centrales:
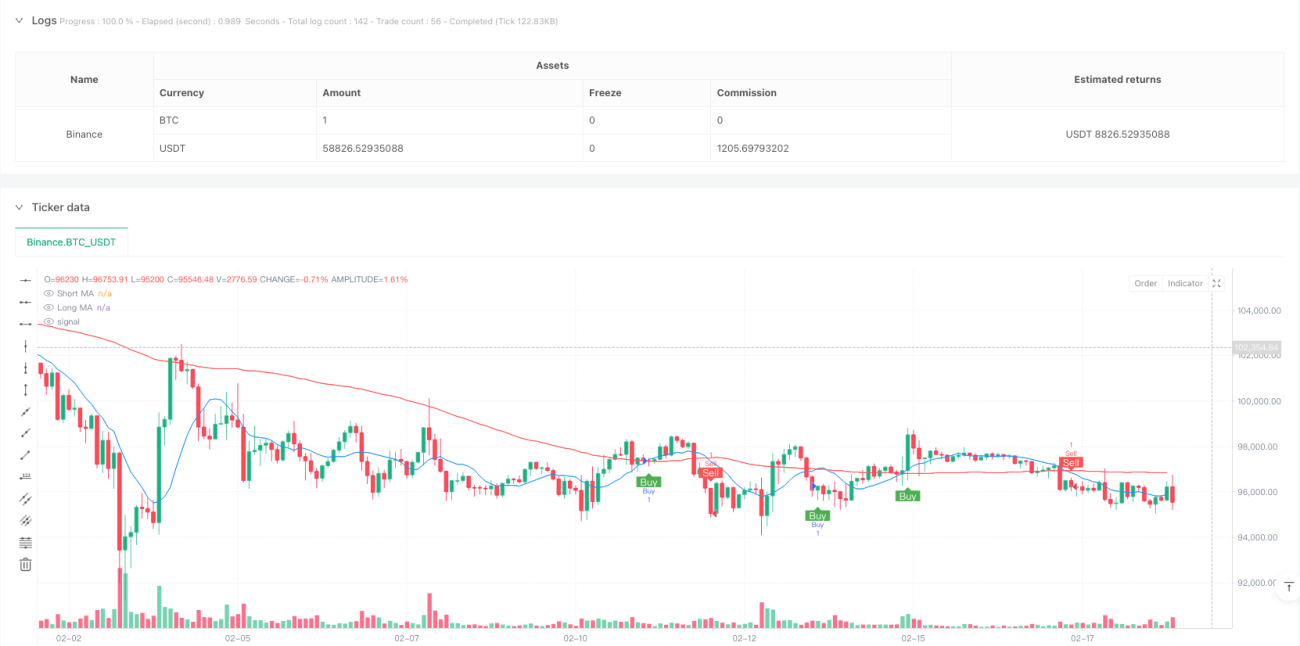
- El sistema de generación de señales utiliza la cruz de las medias móviles simples de corto plazo (de 10 ciclos) y largo plazo (de 100 ciclos) para desencadenar las transacciones. Cuando la media corto plazo cruza la media de largo plazo hacia arriba, se produce una señal de multiplicación y, a su vez, una señal de diferenciación.
- El sistema de gestión de riesgos utiliza el ATR de 14 ciclos multiplicado por un factor de 1,5 para establecer el stop loss dinámico, y el objetivo de ganancias es el doble del stop loss ((ratio de ganancia por riesgo ajustable)).
- El filtro de tiempo permite al usuario establecer un período de tiempo específico para la transacción, ejecutando la transacción solo en el rango de tiempo especificado.
- El mecanismo de período de enfriamiento de la operación establece un período de espera de 10 ciclos para evitar el exceso de operaciones.
- El riesgo de cada transacción está controlado en el 1% de la cuenta.
Ventajas estratégicas
- Gestión de riesgos dinámica: Utiliza el indicador ATR para adaptarse a la volatilidad del mercado y ajustar automáticamente los límites de pérdidas y ganancias en diferentes entornos de mercado.
- Control de riesgo completo: Realizar una gestión de fondos sistematizada mediante la fijación de la relación entre el riesgo y la ganancia y el riesgo por transacción.
- Administración flexible del tiempo: los horarios de negociación se pueden ajustar según las características de las horas de negociación de los diferentes mercados.
- Prevención del exceso de operaciones: El mecanismo de período de enfriamiento evita la generación de señales de exceso de operaciones en períodos de gran volatilidad.
- Efecto de visualización: muestra claramente las señales de negociación y las medias móviles en el gráfico para facilitar el análisis y la optimización.
Riesgo estratégico
- Riesgo de reversión de tendencia: puede generar falsas brechas en mercados convulsos, lo que lleva a pérdidas continuas.
- Sensibilidad de los parámetros: la elección de parámetros como el ciclo de las medias móviles, el multiplicador ATR, etc. puede afectar significativamente el rendimiento de la estrategia.
- El filtro de tiempo mal configurado puede hacer que se pierda una oportunidad de negocio importante.
- El riesgo-beneficio fijo puede no ser lo suficientemente flexible en diferentes entornos de mercado.
Dirección de optimización de la estrategia
- Introducción de filtros de intensidad de tendencia: se puede agregar ADX o indicadores similares para juzgar la intensidad de la tendencia y solo comerciar durante una fuerte tendencia.
- Dinámica de ajuste de la relación entre el riesgo y el beneficio: la relación entre el riesgo y el beneficio se ajusta automáticamente según la volatilidad del mercado o la intensidad de la tendencia.
- Aumentar el análisis del volumen de transacciones: El volumen de transacciones se utiliza como indicador complementario de la confirmación de la señal.
- Mecanismo de optimización del período de refrigeración: la duración del período de refrigeración se ajusta a la dinámica de la volatilidad del mercado.
- Añadir clasificación de entornos de mercado: Utiliza diferentes conjuntos de parámetros en diferentes entornos de mercado.
Resumir
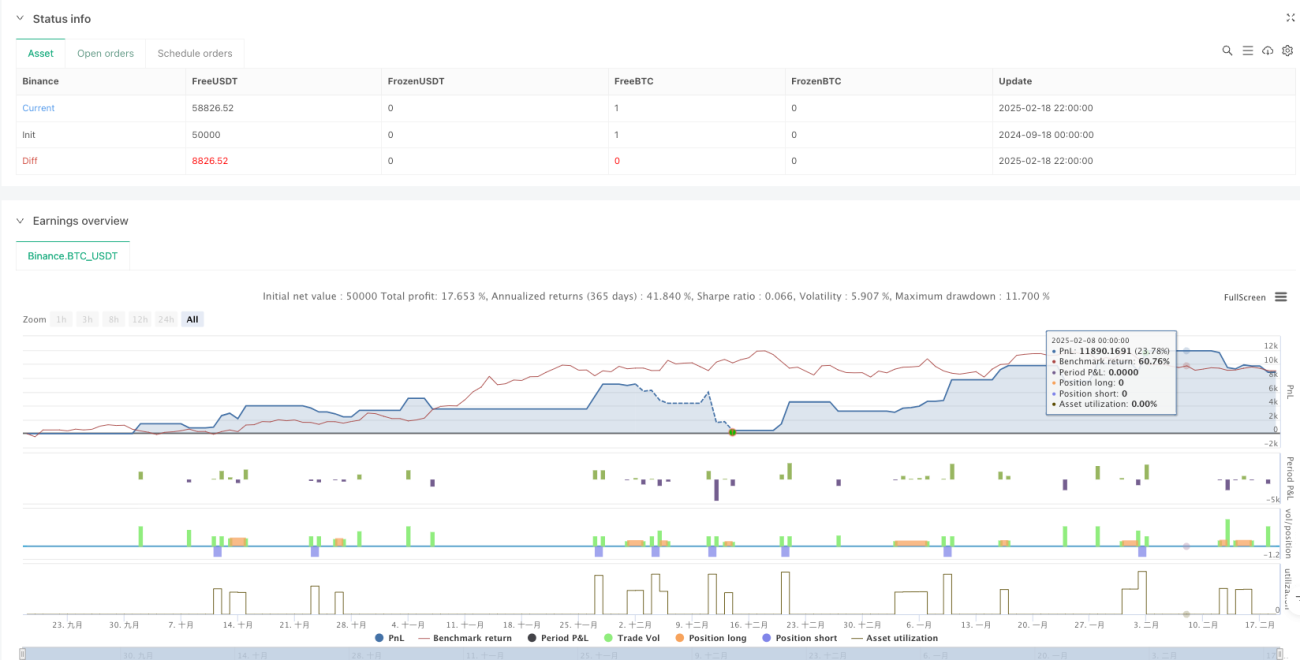
La estrategia combina métodos clásicos de análisis técnico y modernos conceptos de gestión de riesgos para construir un sistema de negociación completo. Sus principales ventajas son la gestión de riesgos dinámica y el mecanismo de filtración múltiple, pero aún así requiere la optimización de los parámetros en función de las características específicas del mercado en la aplicación real. El funcionamiento exitoso de la estrategia requiere que el comerciante entienda en profundidad el papel de los componentes y ajuste los parámetros a tiempo según los cambios en el mercado.
/*backtest
start: 2024-09-18 00:00:00
end: 2025-02-19 00:00:00
period: 2h
basePeriod: 2h
exchanges: [{"eid":"Binance","currency":"BTC_USDT"}]
*/

//@version=5
strategy("Profitable Moving Average Crossover Strategy", shorttitle="Profitable MA Crossover", overlay=true)

// Input parameters for the moving averages- 1