
Descripción general
La estrategia es un sistema de negociación integrado de múltiples indicadores, que combina indicadores técnicos como el promedio móvil de índices (EMA), el indicador de la fuerza relativa (RSI) y el rango real medio (ATR), e introduce el índice de tendencia promedio (ADX) para aumentar la precisión de la determinación de la tendencia. El sistema confirma la hora de establecer una posición a través de múltiples señales y utiliza el ATR para administrar los paros y paros dinámicos para lograr un control efectivo del riesgo.
Principio de estrategia
El núcleo de la estrategia es capturar las tendencias del mercado y operar a través de la combinación de múltiples indicadores técnicos, que incluyen:
- Utiliza el rápido (en 20 ciclos) y el lento (en 50 ciclos) EMA para determinar la dirección de la tendencia
- Combinado con el ADX (ciclo 14) para confirmar la fuerza de la tendencia, se requiere que el ADX> 20 confirme la tendencia
- Utilizando el RSI (ciclo 14) para buscar oportunidades de sobreventa y sobreventa, el RSI supera los 30 para comprar y baja los 70 para vender
- El ATR (14 ciclos) se utiliza para calcular las posiciones dinámicas de stop loss y stop loss, con una relación de riesgo/beneficio de 2:1
Ventajas estratégicas
- La confirmación de múltiples señales mejora la precisión de las transacciones y evita señales falsas
- La introducción de los indicadores ADX aumenta la fiabilidad de los juicios de tendencias
- El mecanismo de suspensión de pérdidas dinámicas se adapta a los cambios en la volatilidad del mercado
- Estricto control de riesgos para garantizar que cada transacción sea controlada
- La lógica de la estrategia es clara y los parámetros son altamente ajustables.
Riesgo estratégico
- Las múltiples señales pueden causar un retraso en la señal y afectar el tiempo de entrada.
- Las operaciones pueden ser frecuentes en mercados convulsionados.
- El indicador ADX puede generar señales de retraso en ciertas condiciones de mercado
- La configuración de los parámetros necesita ser optimizada para diferentes entornos de mercado
Dirección de optimización de la estrategia
- Considere la inclusión de indicadores de volumen de tráfico para mejorar la fiabilidad de la señal
- Introducción de filtros de volatilidad del mercado para ajustar posiciones durante períodos de alta volatilidad
- Desarrollo de mecanismos de parámetros de adaptación que se ajusten a la dinámica de las condiciones del mercado
- Aumentar la escala de la intensidad de la tendencia y la gestión dinámica de las posiciones
- Optimización de la lógica de detención de pérdidas, introducción de un mecanismo de detención móvil
Resumir
La estrategia construye un sistema de comercio de seguimiento de tendencias completo a través de la combinación orgánica de múltiples indicadores técnicos. La estrategia garantiza la seguridad de las transacciones a través de estrictos controles de riesgo, al tiempo que garantiza la precisión de las transacciones. Aunque hay cierto espacio para la optimización, el marco general tiene un buen valor práctico y escalabilidad.
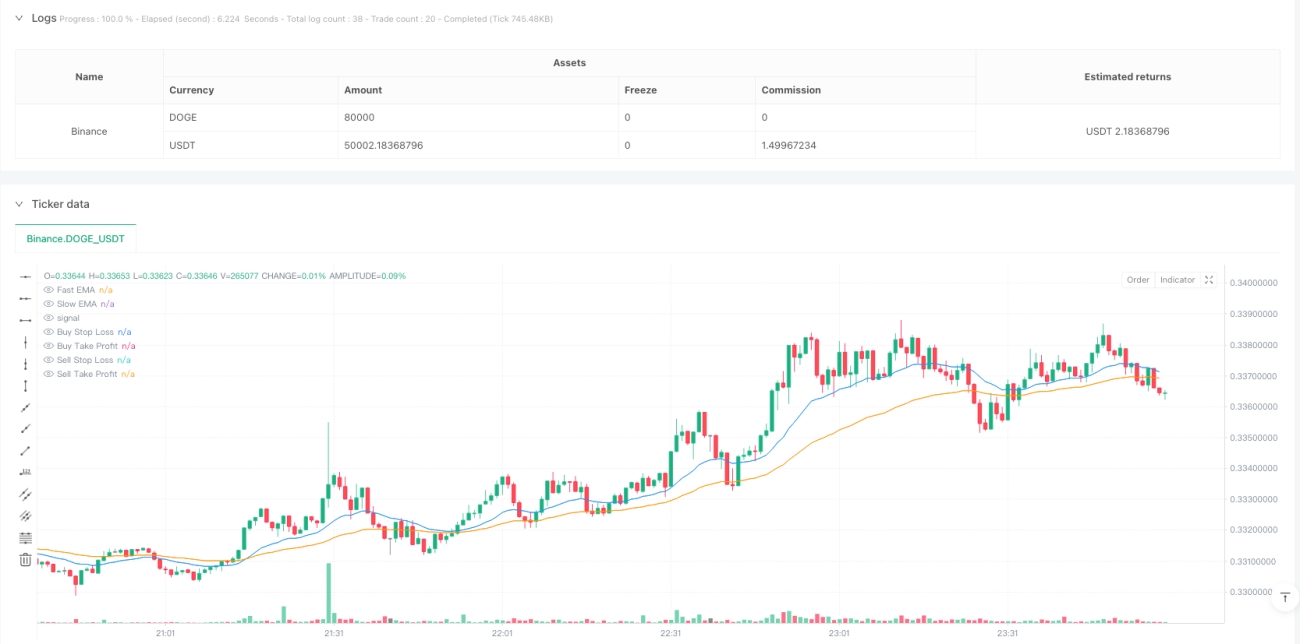
/*backtest
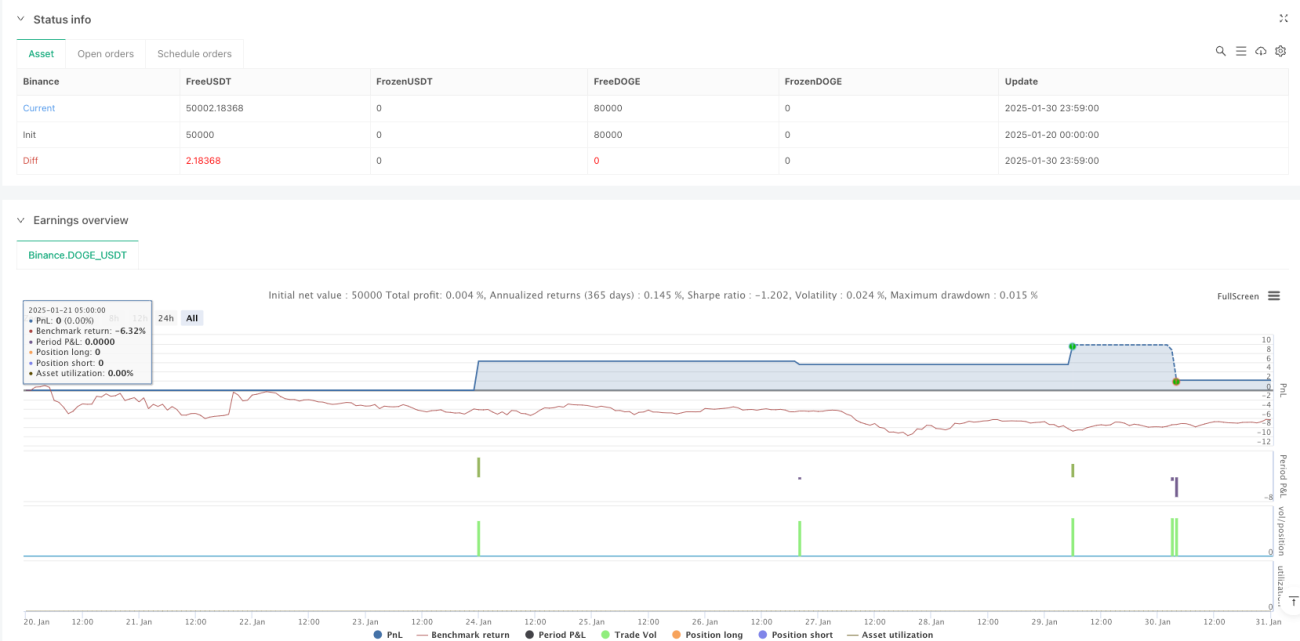
start: 2025-01-20 00:00:00
end: 2025-01-31 00:00:00
period: 1m
basePeriod: 1m
exchanges: [{"eid":"Binance","currency":"DOGE_USDT"}]
*/
//@version=5
strategy("Enhanced GBP/USD Strategy with ADX", overlay=true, default_qty_type=strategy.percent_of_equity, default_qty_value=1)
// === Input Parameters ===- 1