Estrategia comercial de ruptura de canales de seguimiento de tendencias con múltiples indicadores técnicos y sistema de filtrado de patrones de línea K

Descripción general
La estrategia es un sistema de trading de indicadores tecnológicos multidimensional que combina el canal Keltner, la forma de la línea K y el análisis de volumen de transacciones. La estrategia mejora la fiabilidad de las señales de negociación mediante el monitoreo de las rupturas de precios en el canal y la combinación de la forma de la transacción y el grafo de la barra como condiciones de filtración. El sistema diseña un mecanismo de gestión de fondos completo, que incluye una configuración de stop loss y stop loss dinámica basada en el ATR.
Principio de estrategia
La estrategia se basa en los siguientes componentes centrales:
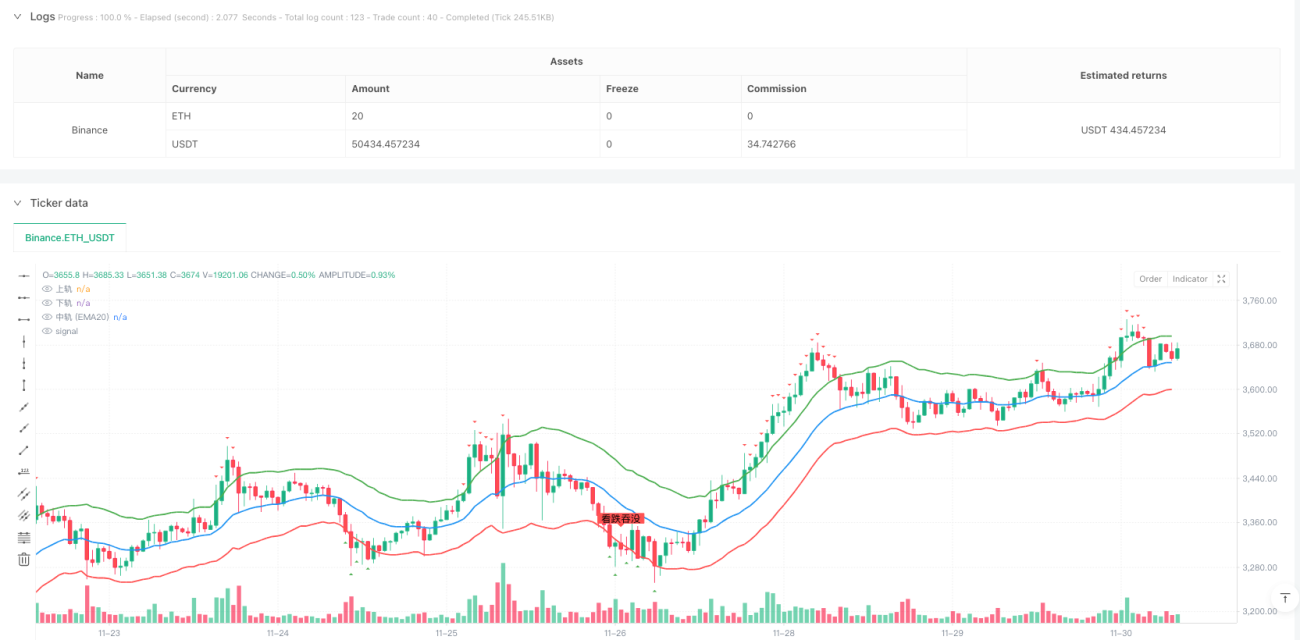
- Utilizando el EMA de 20 ciclos como trayecto medio de la tendencia, en combinación con 1.5 veces el ATR se construye un trayecto ascendente y descendente, formando el canal Kentner
- Identificar oportunidades potenciales de negociación mediante el monitoreo de los precios de cierre de la brecha en los límites del canal
- Filtrado con el indicador de volumen de transacciones, que requiere un volumen de transacciones superior al promedio de 20 ciclos en el momento de la ruptura
- La combinación de la forma de absorción de la oscuridad / caída de la oscuridad como señal de confirmación adicional
- La combinación utiliza 1.5 veces el ATR como stop loss y 2 veces el ATR como stop loss, logrando una relación de riesgo-beneficio de aproximadamente 1:1.33.
Ventajas estratégicas
- Verificación cruzada de múltiples indicadores técnicos para mejorar la fiabilidad de las señales de negociación
- Ancho de canal dinámico para adaptarse a las fluctuaciones del mercado
- La confirmación de transacciones aumenta la eficacia de las señales de transacción
- El filtro K-lineal reduce la interferencia de falsas rupturas
- Mecanismos de detención de pérdidas para proteger la seguridad de los fondos
- Las marcas visuales ayudan a los comerciantes a identificar brechas falsas
Riesgo estratégico
- Las ciudades convulsionadas pueden generar frecuentes falsas señales de ruptura
- El stop loss puede ser demasiado amplio en caso de fluctuaciones extremas.
- Las condiciones de filtración múltiple pueden haber perdido parte de la señal válida
- Formato de absorción de la pérdida de fiabilidad en ciertos entornos de mercado
- La configuración de stop loss con un multiplicador fijo puede no ser adecuada para todos los entornos de mercado
Dirección de optimización de la estrategia
- Introducción de indicadores de intensidad de tendencia (como el ADX) para filtrar los mercados de oscilación
- Desarrollo de un mecanismo de regulación de la multiplicación ATR adaptativo
- Añadir más reconocimiento de forma de línea K para mejorar la calidad de la señal
- El multiplicador de stop loss se ajusta a la fluctuación del mercado
- Añadir filtro de tiempo para evitar operaciones en tiempos desfavorables
- Desarrollar un sistema de clasificación del estado del mercado con diferentes parámetros para diferentes mercados
Resumir
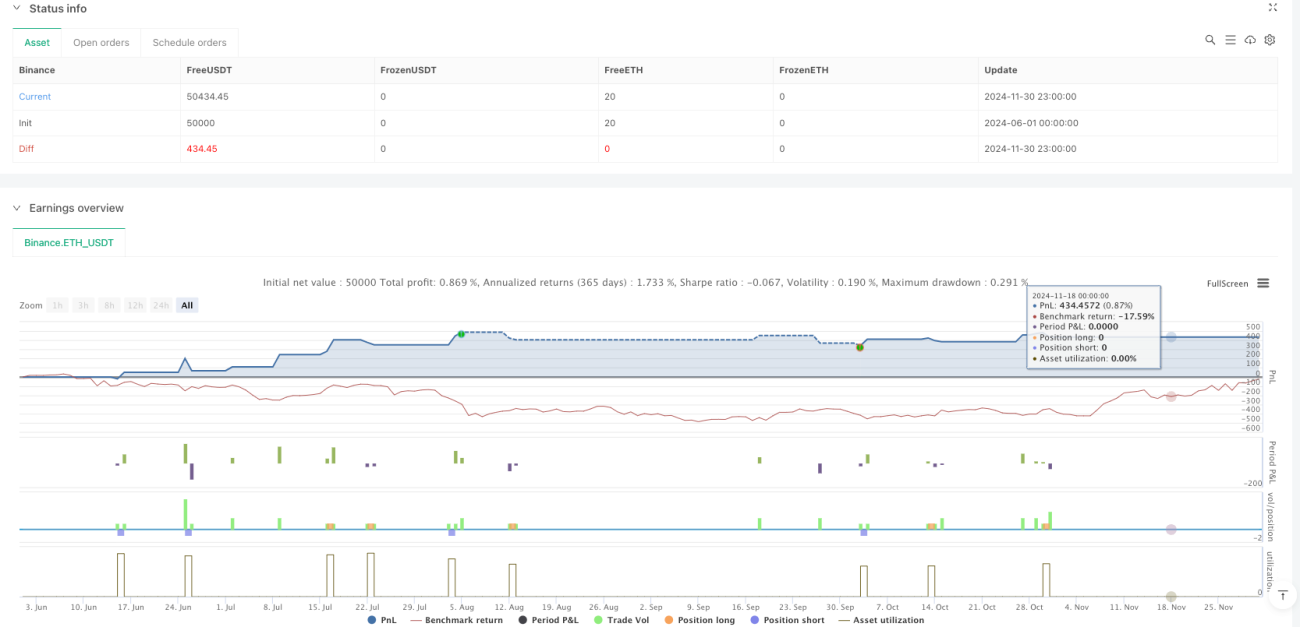
La estrategia integra varias herramientas de análisis técnico para construir un sistema de negociación relativamente completo. Su ventaja radica en el mecanismo de confirmación de múltiples señales y un sistema de gestión de riesgos completo, pero aún así requiere ajustes optimizados según las características específicas del mercado. La aplicación exitosa de la estrategia requiere que el comerciante entienda en profundidad el papel de cada componente y que se mantenga flexible en su uso en operaciones reales.
- 1