
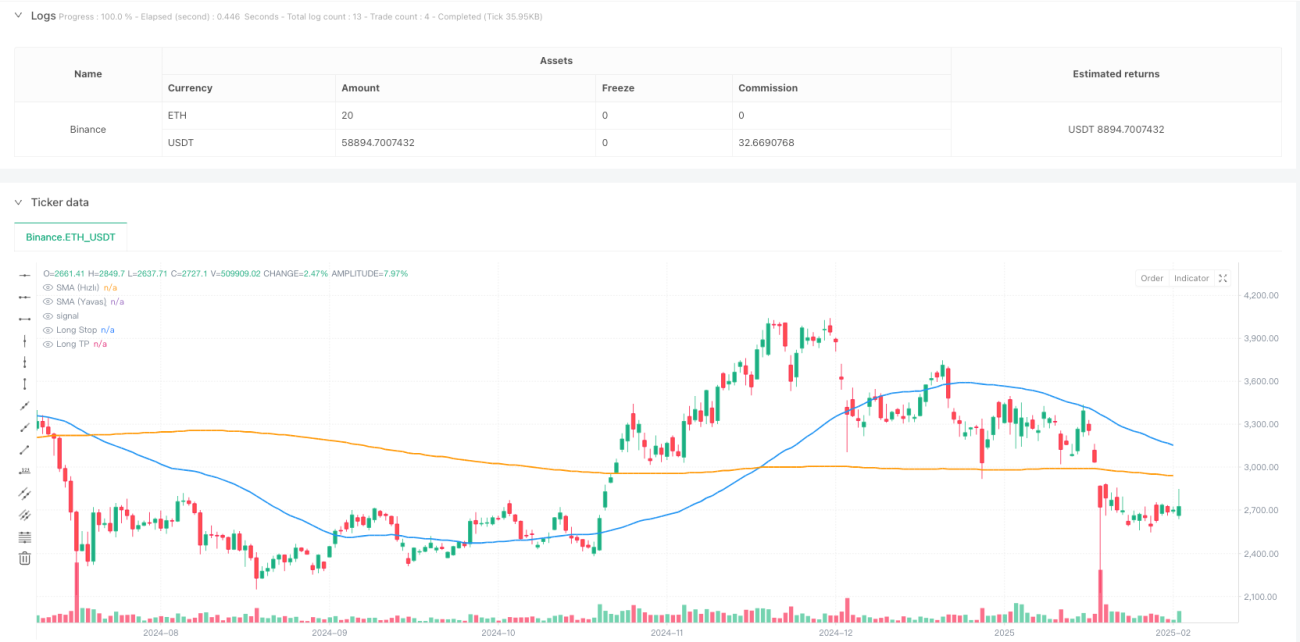
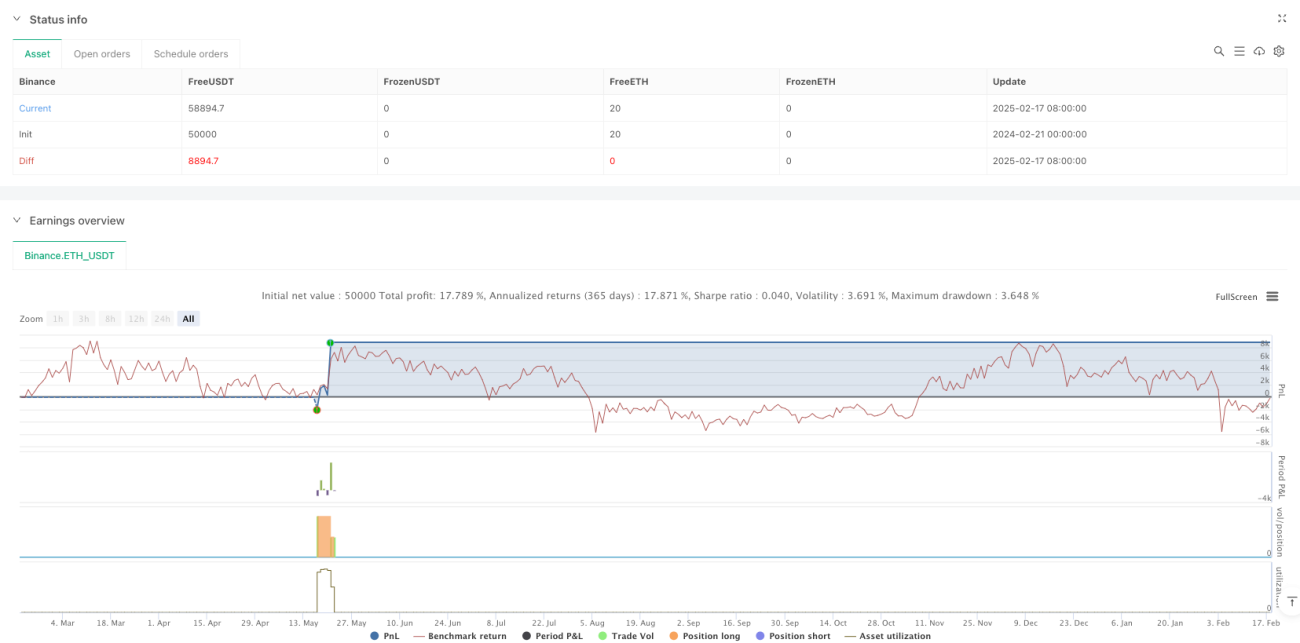
Descripción general
La estrategia es un sistema de seguimiento de tendencias que combina varios indicadores técnicos. Se basa principalmente en señales cruzadas de RSI, MACD y SMA para determinar la dirección de las operaciones, mientras que se utiliza el indicador ATR para ajustar dinámicamente los niveles de parada y ganancia. La estrategia también integra un filtro de volumen de operaciones para garantizar que se negocie con suficiente liquidez en el mercado y utiliza un mecanismo de parada parcial para optimizar la gestión de fondos.
Principio de estrategia
La estrategia utiliza un mecanismo de triple verificación para confirmar las señales de transacción:
- La dirección de las principales tendencias se determina a través de la relación de posición entre la línea media diaria de 50 y 200
- Utilice el RSI para encontrar oportunidades de entrada en el cruce de las zonas de sobrecompra y sobreventa
- Combinado con el indicador MACD para confirmar la dinámica de la tendencia
- El uso de filtros de volumen de transacción asegura suficiente liquidez en el mercado
- Establecimiento de objetivos de stop loss y ganancias dinámicos basados en ATR
El objetivo de la verificación múltiple es reducir las señales falsas y mejorar la precisión de las operaciones. La estrategia se ejecuta cuando se cumplen varias condiciones: (trend up + RSI + MACD up + confirmado el volumen de transacción) abrir una posición y usar 2 veces el ATR como stop loss y 4 veces como stop loss.
Ventajas estratégicas
- Verificación cruzada de múltiples indicadores tecnológicos para reducir las señales falsas
- Mecanismo de pérdidas por volatilidad dinámico, adaptado a diferentes condiciones de mercado
- Utiliza una estrategia de cierre parcial para bloquear parte de las ganancias mientras mantiene un espacio de ganancia
- El filtro de volumen de transacciones asegura suficiente liquidez en el mercado
- Sistema completo de gestión de riesgos, incluido el stop-loss fijo, el stop-loss de seguimiento y el beneficio parcial
Riesgo estratégico
- La multiplicación de indicadores puede hacer que se pierdan algunas oportunidades de negocio
- Puede sufrir grandes caídas en mercados volátiles
- La optimización excesiva de parámetros puede provocar un sobreajuste
- El filtro de volumen de transacciones puede perder oportunidades en mercados con poca liquidez
- El deterioro dinámico puede ser provocado prematuramente durante las altas oscilaciones
Dirección de optimización de la estrategia
- Considerar la inclusión de un mecanismo de adaptación a la volatilidad del mercado para ajustar dinámicamente los parámetros en diferentes entornos de volatilidad
- Introducción de análisis multi-ciclo para mejorar la precisión de las tendencias
- Optimización de la proporción de paradas parciales y adaptación de las estrategias de paradas para diferentes entornos de mercado
- Incrementar los filtros de intensidad de tendencia para evitar el comercio en entornos de tendencia débil
- Considerar la inclusión de análisis de factores estacionales para optimizar el momento de la transacción
Resumir
Se trata de una estrategia integral de seguimiento de tendencias que, mediante el uso de múltiples indicadores técnicos en combinación, establece un sistema de negociación sólido. La principal característica de la estrategia es adaptarse a los cambios en el mercado a través de un mecanismo dinámico de stop loss y ganancias, al tiempo que se garantiza la seguridad.
/*backtest
start: 2024-02-21 00:00:00
end: 2025-02-18 08:00:00
period: 1d
basePeriod: 1d
exchanges: [{"eid":"Binance","currency":"ETH_USDT"}]
*/

//@version=5
strategy(    title="AI Trade Strategy v2 (Extended) - Fixed",    shorttitle="AI_Trade_v2",    overlay=true,    format=format.price,    initial_capital=100000,    default_qty_type=strategy.percent_of_equity,    default_qty_value=100,    pyramiding=0)

//============================================================================- 1