Estrategia de seguimiento de tendencias cruzadas de múltiples indicadores combinada con retroceso de Fibonacci y sistema de optimización de stop-profit y stop-loss

Descripción general
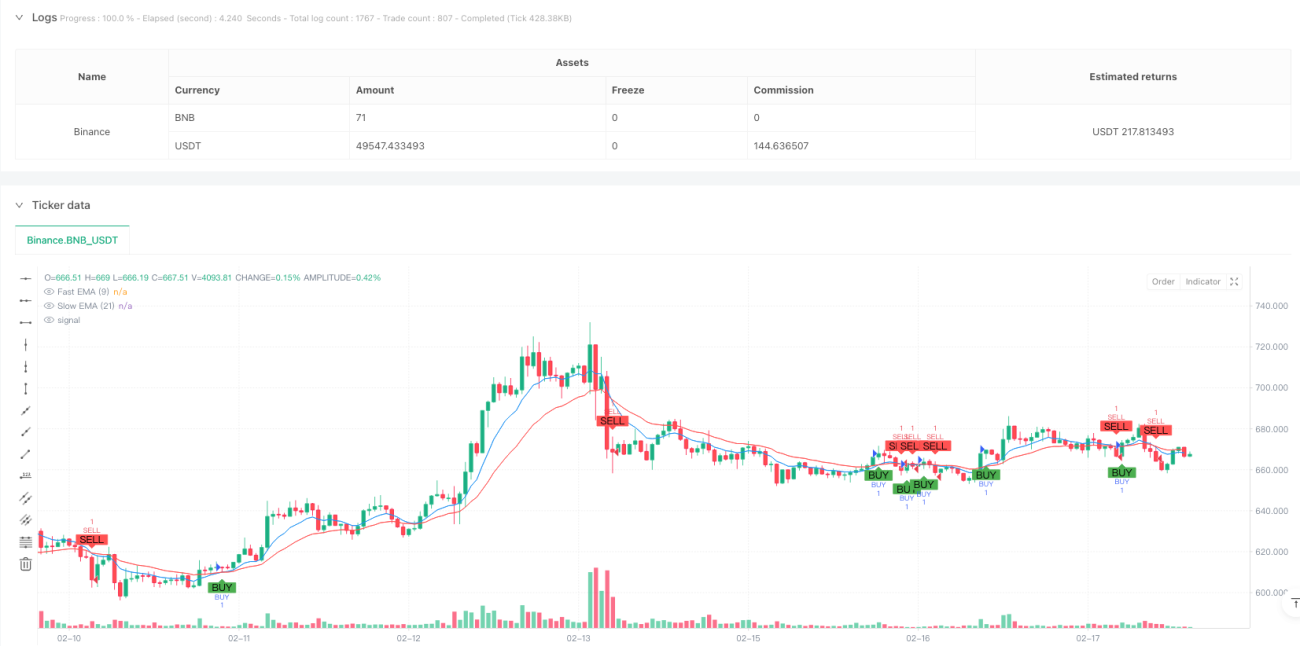
La estrategia es un sistema de negociación integral que combina el cruce de las medias móviles de índice (EMA), los niveles de regresión de Fibonacci, la determinación de tendencias y el mecanismo de parada de pérdidas. La estrategia determina las señales de negociación a través de la cruz de los EMA de 9 y 21 ciclos, mientras que combina los niveles de regresión de Fibonacci para optimizar el punto de entrada y mejorar la precisión de la negociación mediante el monitoreo del estado de la tendencia en tiempo real.
Principio de estrategia
La lógica central de la estrategia se basa en los siguientes elementos clave:
- Cuando el EMA rápido ((9 ciclos) cruza hacia arriba el EMA lento ((21 ciclos), el sistema genera una señal de multisignal
- Cuando el EMA rápido cruza hacia abajo el EMA lento, el sistema genera una señal de vacío
- Calculando los máximos y mínimos de 100 ciclos, se trazan niveles de Fibonacci de 23,6%, 38,2%, 50% y 61,8%
- Juzgar el estado de la tendencia actual a través de la relación entre el precio de cierre y la posición del EMA rápido
- En la ejecución de la operación, el sistema establece automáticamente un límite de parada de porcentaje fijo (%) y un límite de pérdida (%)
Ventajas estratégicas
- Confirmación de señales multidimensionales: combinación de cruces EMA, niveles de Fibonacci y estado de tendencia para proporcionar señales de negociación más confiables
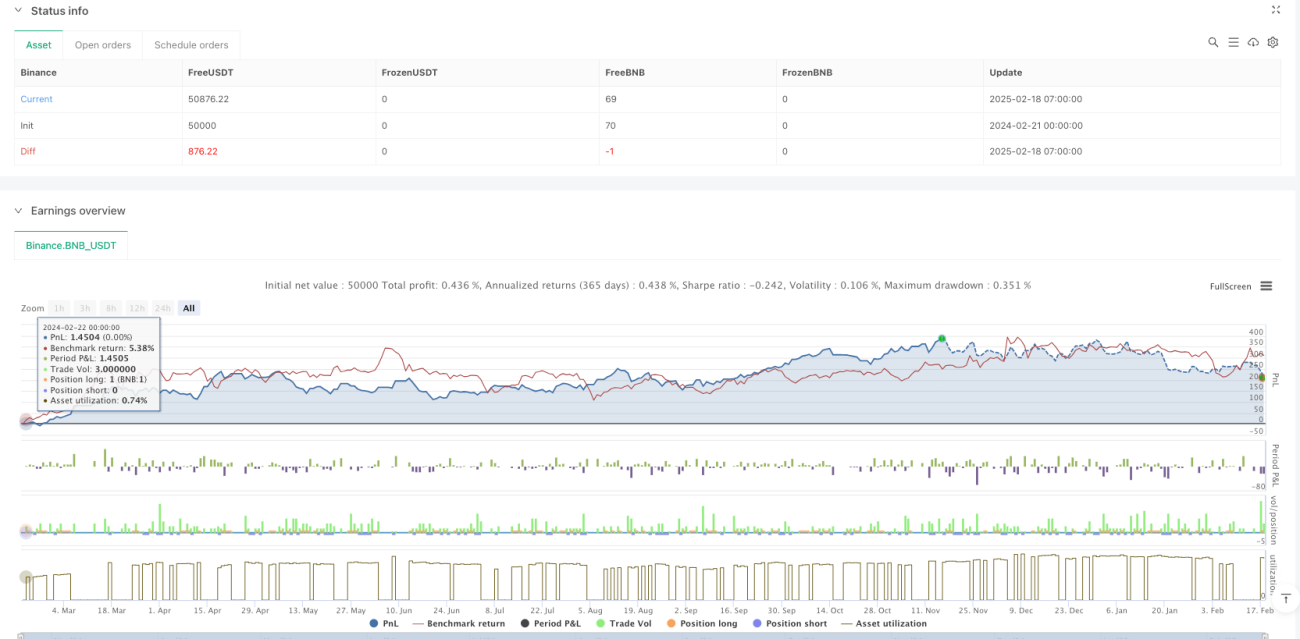
- Gestión de riesgos perfecta: control de riesgos automatizado con porcentaje de stop loss predeterminado
- La capacidad de seguimiento de tendencias es fuerte: la EMA cruza el estado de la tendencia para capturar la tendencia del mercado
- Comentarios visuales claros: etiquetas que muestran los niveles de precios clave, el estado de la tendencia y las señales de negociación para facilitar la toma de decisiones comerciales
- Alta sistematización: la lógica de las transacciones es clara, reduciendo la interferencia de los juicios subjetivos
Riesgo estratégico
- Riesgo de mercado oscilante: frecuentes cruces de EMA pueden dar lugar a falsas señales en la fase de recolección horizontal
- Riesgo de retraso: las medias móviles son un indicador de retraso en su esencia, y pueden perderse la mejor oportunidad de entrada
- Riesgo de pérdidas fijas: el porcentaje fijo de pérdidas fijas puede no ser adecuado para todos los entornos de mercado
- Riesgo de conflictos de señales: puede haber señales contradictorias entre varios indicadores, lo que aumenta la dificultad para tomar decisiones
- Riesgo de fluctuaciones en el mercado: las fuertes fluctuaciones pueden llevar a un stop loss no razonable
Dirección de optimización de la estrategia
- Optimización de stop loss dinámico: puede ajustar la distancia de stop loss en función del ATR o la volatilidad del mercado
- Mejora de la filtración de señales: aumenta los indicadores auxiliares como el volumen de tráfico, el impulso para filtrar las señales falsas
- Adaptación de parámetros: introducción de un mecanismo de adaptación para ajustar el ciclo EMA en función de la situación dinámica del mercado
- Optimización de la entrada: optimización de la entrada cerca de los niveles de Fibonacci combinando la configuración del precio y el volumen de transacción
- Gestión de posiciones perfeccionada: un sistema de gestión de posiciones dinámico diseñado en función de la volatilidad y el riesgo de la cuenta
Resumir
Esta estrategia integra varias herramientas de análisis técnico clásico para construir un sistema de negociación más completo. Sus ventajas son la multi-dimensionalidad de la confirmación de señales y la sistematización de la gestión de riesgos, pero aún así se necesita optimizar para diferentes entornos de mercado.
- 1