
Descripción general
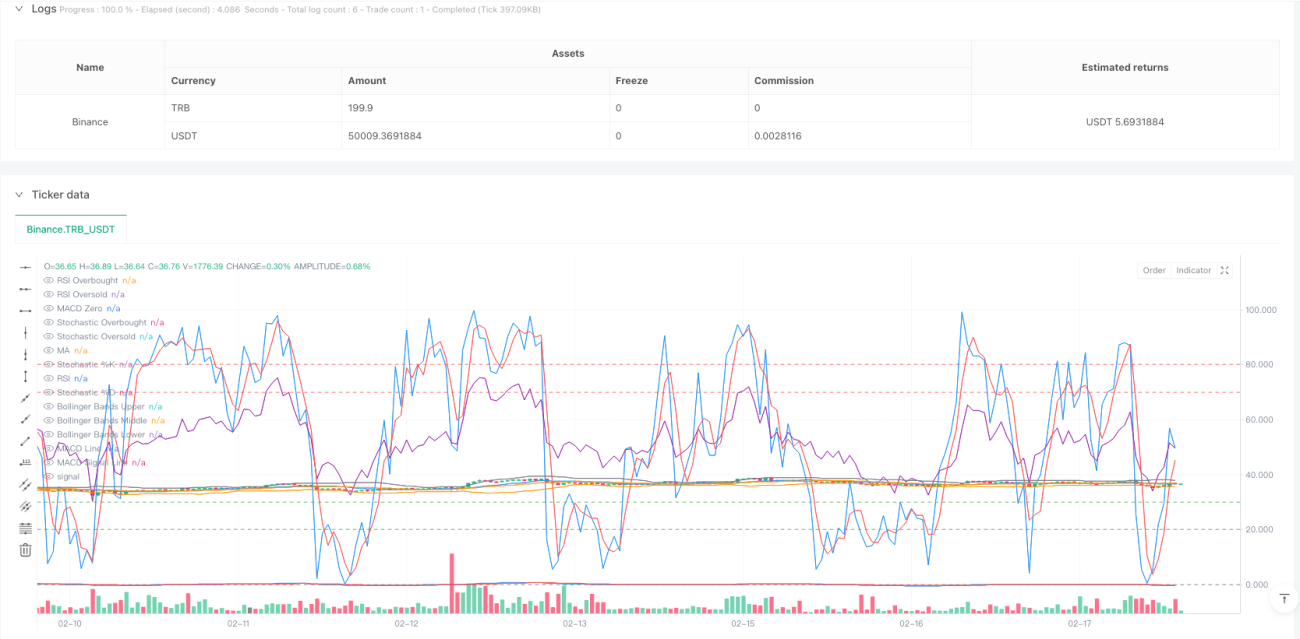
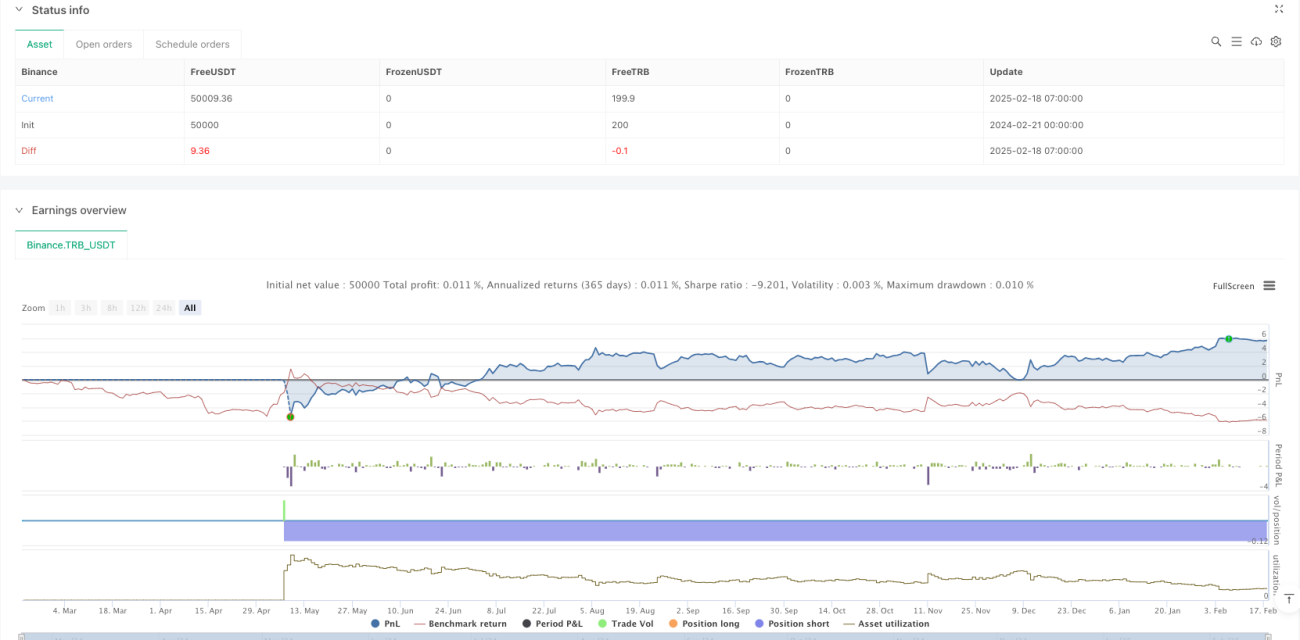
La estrategia es un sistema de comercio de seguimiento de tendencias basado en múltiples indicadores técnicos, que integra varios indicadores técnicos, como el promedio móvil (MA), el indicador relativamente fuerte (RSI), el cinturón de Brin (BB), el promedio móvil de dispersión (MACD) y el indicador aleatorio (Stochastic), para identificar las tendencias del mercado y las oportunidades de negociación a través de la confirmación cruzada entre los indicadores. La estrategia adopta un método de gestión de posición porcentual, con el uso predeterminado del 1% de fondos en cada transacción.
Principio de estrategia
La estrategia determina las señales de transacción a través de las siguientes dimensiones:
- Utiliza una media móvil simple de 14 períodos (SMA) como referencia para indicar tendencias
- El RSI se utiliza para determinar si una persona está sobrecomprando o sobrevendendo, y establece 30 y 70 como los mínimos críticos.
- El canal de la cinta de Brin se utiliza para determinar el rango de fluctuación de los precios, con un período de 20
- Los indicadores MACD ((12,26,9) se utilizan para la confirmación de tendencias
- Indicador aleatorio ((14,3) utilizado para juzgar la dinámica
Para hacer esto, se requiere que se cumplan las siguientes condiciones:
- RSI bajo 30 (sobrevendido)
- El MACD se mueve en línea
- Valor de K aleatorio menor a 20
- El precio de cierre es más alto que el de la banda central de Brin.
- El cierre anterior fue inferior al de la banda de Bryn.
Las condiciones de despeje deben cumplirse al mismo tiempo:
- El RSI está por encima de 70 (sobrecompra)
- El MACD está en línea.
- Valor aleatorio de K mayor que 80
- El precio de cierre está por debajo de la línea media de la banda de Brin.
- El precio de cierre anterior fue más alto que el de la banda de Brin.
Ventajas estratégicas
- La identificación cruzada de múltiples indicadores tecnológicos puede filtrar de manera efectiva las señales falsas
- Indicadores combinados de seguimiento de tendencias y de convulsiones, tanto para tendencias como para reveses
- La adopción de la gestión de la posición porcentual para controlar el riesgo de manera efectiva
- Los parámetros del indicador son ajustables y tienen una buena adaptabilidad
- Las señales de transacción son claras, fáciles de ejecutar y de rastrear
Riesgo estratégico
- Las múltiples señales pueden causar un retraso en la señal y afectar el tiempo de entrada.
- El mercado en crisis podría ser más frecuente y costoso
- Los parámetros fijos se comportan de manera diferente en diferentes entornos de mercado
- Los indicadores técnicos pueden ser contradictorios y causar confusión en las señales
Se recomienda tomar las siguientes medidas para evitar el riesgo:
- Parámetros de ajuste dinámico en función de las diferentes características del mercado
- Establezca un parador de pérdidas para controlar el riesgo
- Combinación de otros indicadores como el tráfico para la confirmación de señales
- Evaluar periódicamente el rendimiento de la estrategia y hacer ajustes oportunos
Dirección de optimización de la estrategia
- Introducción de un mecanismo de parámetros de adaptación para ajustar los parámetros del indicador en función de la dinámica de la volatilidad del mercado
- Adición de índices de transacción como confirmación auxiliar
- Optimización de la gestión de las existencias, considerando la construcción y reducción de existencias por lotes
- Aumentar el módulo de identificación del entorno de mercado para adoptar diferentes estrategias en diferentes situaciones
- Introducción de algoritmos de aprendizaje automático para optimizar la lógica de generación de señales
Resumir
La estrategia se caracteriza por la fiabilidad de la señal y el control de los riesgos, pero aún así requiere una optimización continua de los parámetros y la lógica en el mercado real. A través de la mejora y el perfeccionamiento continuos, la estrategia espera obtener ganancias estables en diferentes entornos de mercado.
- 1