Estrategia de trading de tendencia dinámica basada en múltiples períodos de tiempo, exponente de Hurst y retroceso de Fibonacci

HURST FIBONACCI RSI MTF RR SL TP ATR
Fecha de creación: 2025-02-20 16:59:37 Última modificación: 2025-02-20 16:59:37
Copiar: 2 Número de Visitas: 393
2
Seguir
319
Seguidores

Estrategia de trading de tendencia dinámica basada en múltiples períodos de tiempo, exponente de Hurst y retroceso de Fibonacci Estrategia de trading de tendencia dinámica basada en múltiples períodos de tiempo, exponente de Hurst y retroceso de Fibonacci

Descripción general

Esta es una estrategia de comercio innovadora de varios ciclos de tiempo que combina el exponente de Hurst y los niveles de retroceso de Fibonacci. La estrategia evalúa las características de la tendencia del mercado mediante el cálculo del índice de Hurst en diferentes períodos de tiempo y identifica oportunidades de comercio potenciales en combinación con los niveles de precios clave de Fibonacci. La estrategia adopta un marco riguroso de gestión de riesgos que incluye proporciones de riesgo fijas, porcentajes de ganancias y pérdidas objetivo y límites de frecuencia de negociación diaria y total.

Principio de estrategia

La lógica central de la estrategia se basa en dos componentes principales:

  1. Se evalúa la naturaleza de la tendencia del mercado mediante el cálculo del índice de Herst para el período actual y superior. Un índice de Herst mayor a 0.5 indica que el mercado tiene una tendencia de continuidad, y menor a 0.5 indica que el mercado puede tener una característica de regresión a la media.
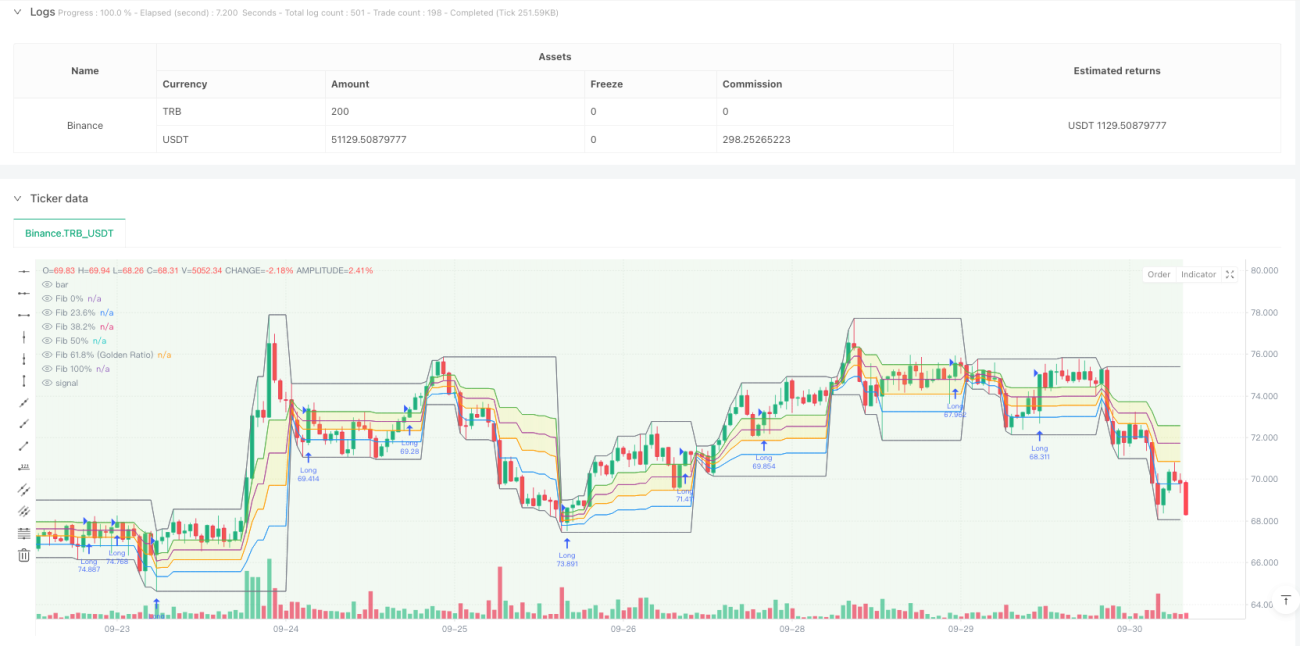
  2. Utilizando el nivel de retracción de Fibonacci clave para calcular los máximos y mínimos diarios, se enfoca en los dos niveles del 61.8% (la división del oro) y el 38.2%. Cuando el índice de Herst de la línea diaria sea mayor que 0.5 y el precio supere el nivel del 61.8%, se activa la señal de más; cuando el índice de Herst de la línea diaria sea menor que 0.5 y el precio baje por debajo del nivel del 38.2%, se activa la señal de vacío.

Ventajas estratégicas

  1. Análisis multidimensional: proporciona una visión más completa del mercado mediante la combinación de análisis de tendencias y niveles de precios en diferentes períodos de tiempo
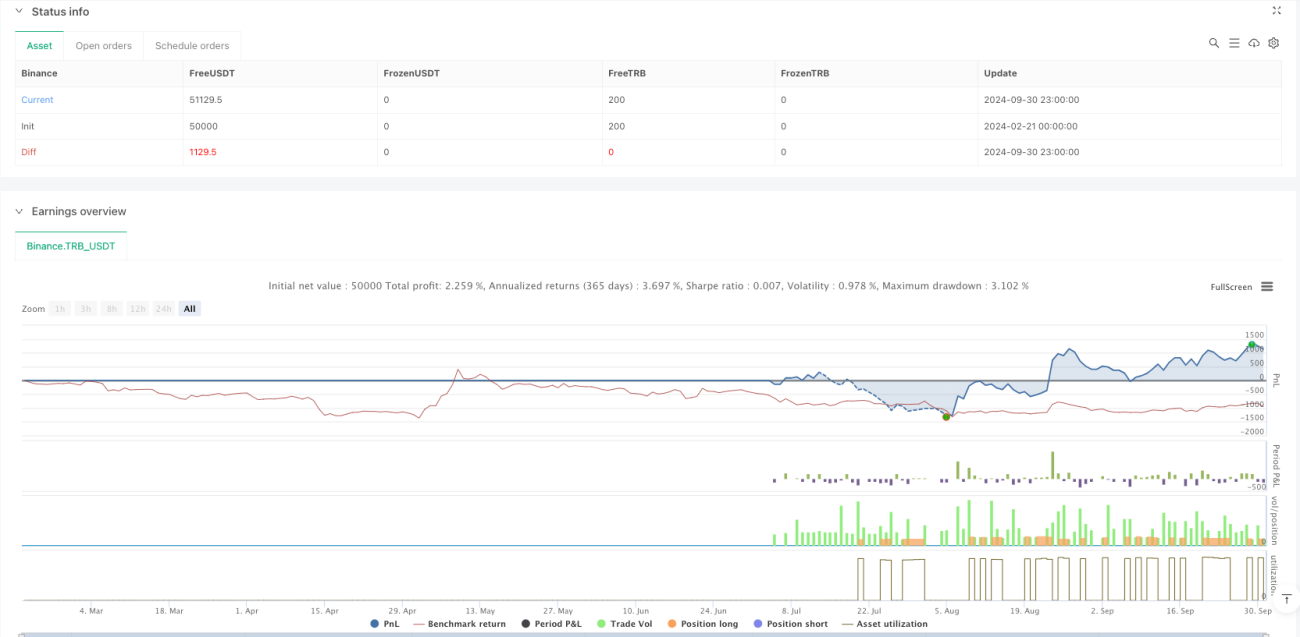
  2. Gestión de riesgos: marco de gestión de riesgos con un índice de riesgo fijo (%) y un objetivo de rentabilidad (%)
  3. Control de la frecuencia de las transacciones: establezca un límite máximo de transacciones diarias y un límite de transacciones totales para evitar el exceso de transacciones
  4. Ayuda visual: tablas con información sobre el cambio de color de fondo y los indicadores clave de las tendencias del mercado en tiempo real

Riesgo estratégico

  1. Dependencia del entorno del mercado: puede tener un desempeño deficiente en mercados horizontales sin tendencias claras
  2. Sensibilidad de parámetros: la elección del ciclo de cálculo del índice de Herst y el período de tiempo de Fibonacci afectan el rendimiento de la estrategia
  3. Efectos del deslizamiento: en condiciones de mercado con poca liquidez, puede haber un mayor riesgo de deslizamiento
  4. Complejidad del sistema: combinaciones de varios componentes aumentan la probabilidad de que las estrategias no funcionen

Dirección de optimización de la estrategia

  1. Ajuste de parámetros dinámicos: puede ajustar automáticamente el ciclo de cálculo del índice de Hearst en función de la volatilidad del mercado
  2. Aumento de filtros: introducción de filtros adicionales de estado de mercado para mejorar la calidad de la señal
  3. Optimización de la gestión de las posiciones: gestión dinámica de las posiciones basada en la volatilidad
  4. Mejora en el mecanismo de salida: desarrollo de una forma más flexible de establecer objetivos de ganancias

Resumir

Se trata de una estrategia innovadora que combina las herramientas clásicas del análisis técnico con métodos modernos de cuantificación. A través de análisis de múltiples ciclos de tiempo y una estricta gestión de riesgos, la estrategia mantiene una base teórica pero también se centra en la viabilidad práctica. Aunque existe cierto espacio de optimización, el marco general tiene una buena extensibilidad y valor práctico.

Código Fuente de la Estrategia
/*backtest
start: 2024-02-21 00:00:00
end: 2024-10-01 00:00:00
period: 1h
basePeriod: 1h
exchanges: [{"eid":"Binance","currency":"TRB_USDT"}]
*/

//@version=5
// Advanced Multi-Timeframe Trading System (Risk Managed)
// 
// Description:
// This strategy combines an approximate measure of market trending via a Hurst exponent
// calculation with Fibonacci retracement levels derived from a higher timeframe (default: Daily)
// to identify potential reversal zones and trade opportunities. The Hurst exponent is calculated
// as a rough indicator of market persistence, while the Fibonacci retracement levels provide potential
// support and resistance areas.
// 
// Signal Logic:
// - A long entry is signaled when the price crosses above the 61.8% Fibonacci level (Golden Ratio)
//   and the daily Hurst exponent is above 0.5 (suggesting a trending market).
// - A short entry is signaled when the price crosses below the 38.2% Fibonacci level and the daily Hurst
//   exponent is below 0.5.
// 
// Risk Management:
// Each trade is risk-managed with a stop-loss set at 2% below (or above for shorts) the entry price,
// and a take profit order is set to achieve a 1:2 risk-reward ratio. Position sizing is fixed at 10% of
// equity per trade. Additionally, the strategy limits trading to a maximum of 5 trades per day and 510 trades
// overall (for backtesting since 2019) to ensure a realistic number of orders.
// 
// Backtesting Parameters:
// - Initial Capital: $10,000
// - Commission: 0.1% per trade
// - Slippage: 1 tick per bar
// - Position Sizing: 10% of equity per trade
// 
// Disclaimer:
// Past performance is not indicative of future results. This strategy is experimental and is provided solely
// for educational purposes. Use caution and perform your own testing before any live deployment.
// 
// Author: [Your Name]
// Date: [Date]

strategy("Advanced Multi-Timeframe Trading System (Risk Managed)",
     overlay=true, 
     max_bars_back=500, 
     initial_capital=10000, 
     default_qty_type=strategy.percent_of_equity, 
     default_qty_value=10,          // 10% of equity per trade
     commission_type=strategy.commission.percent, 
     commission_value=0.1,          // 0.1% commission per trade
     slippage=1,                    // 1 tick per bar
     calc_on_order_fills=true, 
     calc_on_every_tick=true)

// ─── INPUTS ─────────────────────────────────────────────────────────────
hurstLen        = input.int(50, title="Hurst Lookback Period", minval=10)
fibTF           = input.timeframe("D", title="Fibonacci Retracement Timeframe")
maxTradesPerDay = input.int(5, title="Max Trades Per Day", minval=1)
maxTotalTrades  = input.int(510, title="Max Total Trades since 2019", minval=1)
riskPerc        = input.float(2.0, title="Risk Percent per Trade (%)", step=0.1) * 0.01  // 2% risk per trade
rrRatio         = input.float(2.0, title="Risk-Reward Ratio", step=0.1)                 // Target profit = 2x risk

// ─── FUNCTION: Approximate Hurst Exponent Calculation ──────────────────────
// This function uses a simple rescaled range method to approximate the Hurst exponent.
// Note: This is an experimental calculation and should be interpreted as a rough gauge of market trending.
calcHurst(src, len) =>
    mean   = ta.sma(src, len)
    dev    = src - mean
    cumDev = 0.0
    for i = 0 to len - 1
        cumDev := cumDev + dev[i]
    R     = ta.highest(cumDev, len) - ta.lowest(cumDev, len)
    S     = ta.stdev(src, len)
    hurst = na(S) or S == 0 ? na : math.log(R / S) / math.log(len)
    hurst

// Calculate the Hurst exponent on the current timeframe and from a higher timeframe (daily)
currHurst  = calcHurst(close, hurstLen)
dailyHurst = request.security(syminfo.tickerid, "D", calcHurst(close, hurstLen))

// ─── FIBONACCI RETRACEMENT LEVELS (WITH GOLDEN RATIO) ──────────────────────────
// Retrieve the daily high/low from the selected timeframe (default: Daily)
dHigh   = request.security(syminfo.tickerid, fibTF, high)
dLow    = request.security(syminfo.tickerid, fibTF, low)

// Define Fibonacci levels between the daily low and high.
fib_0   = dLow
fib_100 = dHigh
fib_236 = dLow + 0.236 * (dHigh - dLow)
fib_382 = dLow + 0.382 * (dHigh - dLow)
fib_500 = dLow + 0.5   * (dHigh - dLow)
fib_618 = dLow + 0.618 * (dHigh - dLow)  // Golden ratio level

// Plot the Fibonacci levels for reference.
pFib0   = plot(fib_0,   color=color.gray,   title="Fib 0%")
pFib236 = plot(fib_236, color=color.blue,   title="Fib 23.6%")
pFib382 = plot(fib_382, color=color.orange, title="Fib 38.2%")
pFib500 = plot(fib_500, color=color.purple, title="Fib 50%")
pFib618 = plot(fib_618, color=color.green,  title="Fib 61.8% (Golden Ratio)")
pFib100 = plot(fib_100, color=color.gray,   title="Fib 100%")
// Fill the area between the 61.8% and 38.2% levels to highlight the key retracement zone.
fill(pFib618, pFib382, color=color.new(color.yellow, 80), title="Fibonacci Retracement Zone")

// ─── TRADE COUNT MANAGEMENT ─────────────────────────────────────────────────
// To simulate realistic trading frequency, the strategy limits trades to a maximum of 5 per day and 510 overall.
var int tradesToday     = 0
var int globalTradeCount = 0

// Reset the daily trade counter at the start of a new day.
newDay = ta.change(time("D"))
if newDay
    tradesToday := 0

// Allow new trades only if within the daily and overall trade limits.
canTrade = (tradesToday < maxTradesPerDay) and (globalTradeCount < maxTotalTrades)

// ─── TRADING SIGNALS ─────────────────────────────────────────────────────────
// Entry conditions based on Fibonacci levels and daily Hurst conditions:
// • Long: Price crosses above the 61.8% (Golden Ratio) level and daily Hurst > 0.5.
// • Short: Price crosses below the 38.2% level and daily Hurst < 0.5.
longCond  = ta.crossover(close, fib_618) and (dailyHurst > 0.5)
shortCond = ta.crossunder(close, fib_382) and (dailyHurst < 0.5)

if longCond and canTrade
    strategy.entry("Long", strategy.long)
    tradesToday      := tradesToday + 1
    globalTradeCount := globalTradeCount + 1

if shortCond and canTrade
    strategy.entry("Short", strategy.short)
    tradesToday      := tradesToday + 1
    globalTradeCount := globalTradeCount + 1

// ─── RISK MANAGEMENT: STOP-LOSS & TAKE-PROFIT ──────────────────────────────
// For active positions, define stop-loss and take profit levels based on the entry price.
// This ensures that each trade risks approximately 2% of the entry price with a target
// of 2x the risk (1:2 risk-reward ratio).
if strategy.position_size > 0
    longStop   = strategy.position_avg_price * (1 - riskPerc)
    longTarget = strategy.position_avg_price * (1 + rrRatio * riskPerc)
    strategy.exit("Long Exit", from_entry="Long", stop=longStop, limit=longTarget)
if strategy.position_size < 0
    shortStop   = strategy.position_avg_price * (1 + riskPerc)
    shortTarget = strategy.position_avg_price * (1 - rrRatio * riskPerc)
    strategy.exit("Short Exit", from_entry="Short", stop=shortStop, limit=shortTarget)

// ─── CHART OVERLAYS & VISUAL AIDS ────────────────────────────────────────────
// Background color indicates the daily market trend:
// Green for trending conditions (dailyHurst > 0.5) and red for less trending conditions.
bgcolor(dailyHurst > 0.5 ? color.new(color.green, 90) : color.new(color.red, 90), title="Daily Trend Background")

// Display an information table in the top-right corner to help interpret key values.
var table infoTable = table.new(position.top_right, 2, 4, border_width=1, frame_color=color.gray)
if barstate.islast
    table.cell(infoTable, 0, 0, "Current Hurst", text_color=color.white, bgcolor=color.black)
    table.cell(infoTable, 1, 0, str.tostring(currHurst, "#.###"), text_color=color.white, bgcolor=color.black)
    table.cell(infoTable, 0, 1, "Daily Hurst", text_color=color.white, bgcolor=color.black)
    table.cell(infoTable, 1, 1, str.tostring(dailyHurst, "#.###"), text_color=color.white, bgcolor=color.black)
    table.cell(infoTable, 0, 2, "Trades Today", text_color=color.white, bgcolor=color.black)
    table.cell(infoTable, 1, 2, str.tostring(tradesToday), text_color=color.white, bgcolor=color.black)
    table.cell(infoTable, 0, 3, "Global Trades", text_color=color.white, bgcolor=color.black)
    table.cell(infoTable, 1, 3, str.tostring(globalTradeCount), text_color=color.white, bgcolor=color.black)

// Optional: Add labels on the final bar to mark the key Fibonacci levels.
if barstate.islast
    label.new(bar_index, fib_618, "61.8% (Golden Ratio)", style=label.style_label_left, color=color.green, textcolor=color.white, size=size.tiny)
    label.new(bar_index, fib_382, "38.2%", style=label.style_label_left, color=color.orange, textcolor=color.white, size=size.tiny)