Estrategia de cruce de medias móviles exponenciales con ruptura de tendencia dinámica
EMA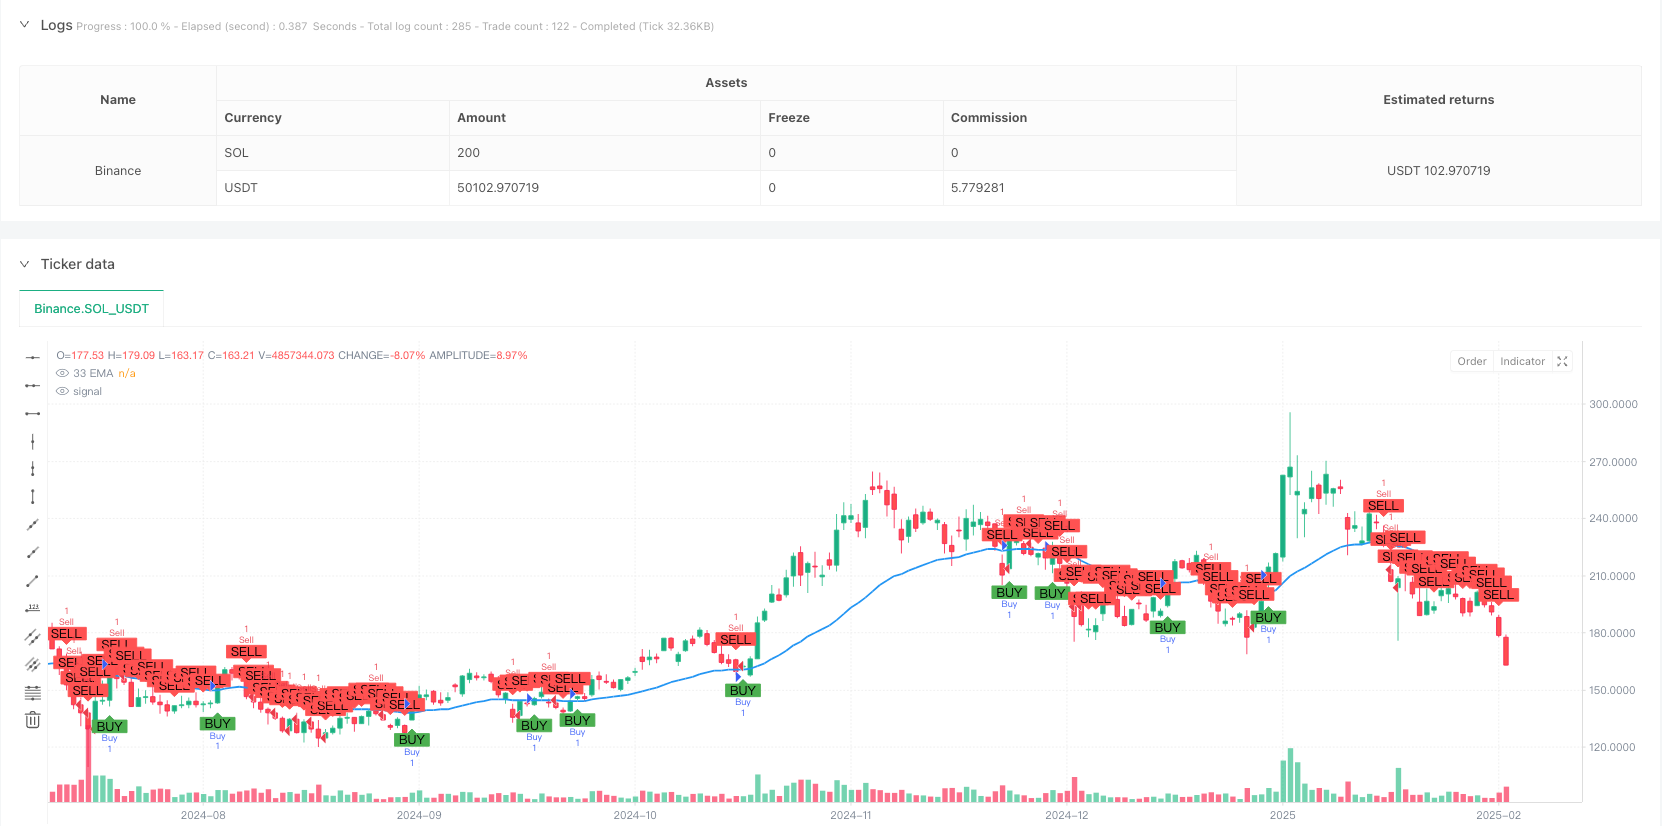
Descripción general
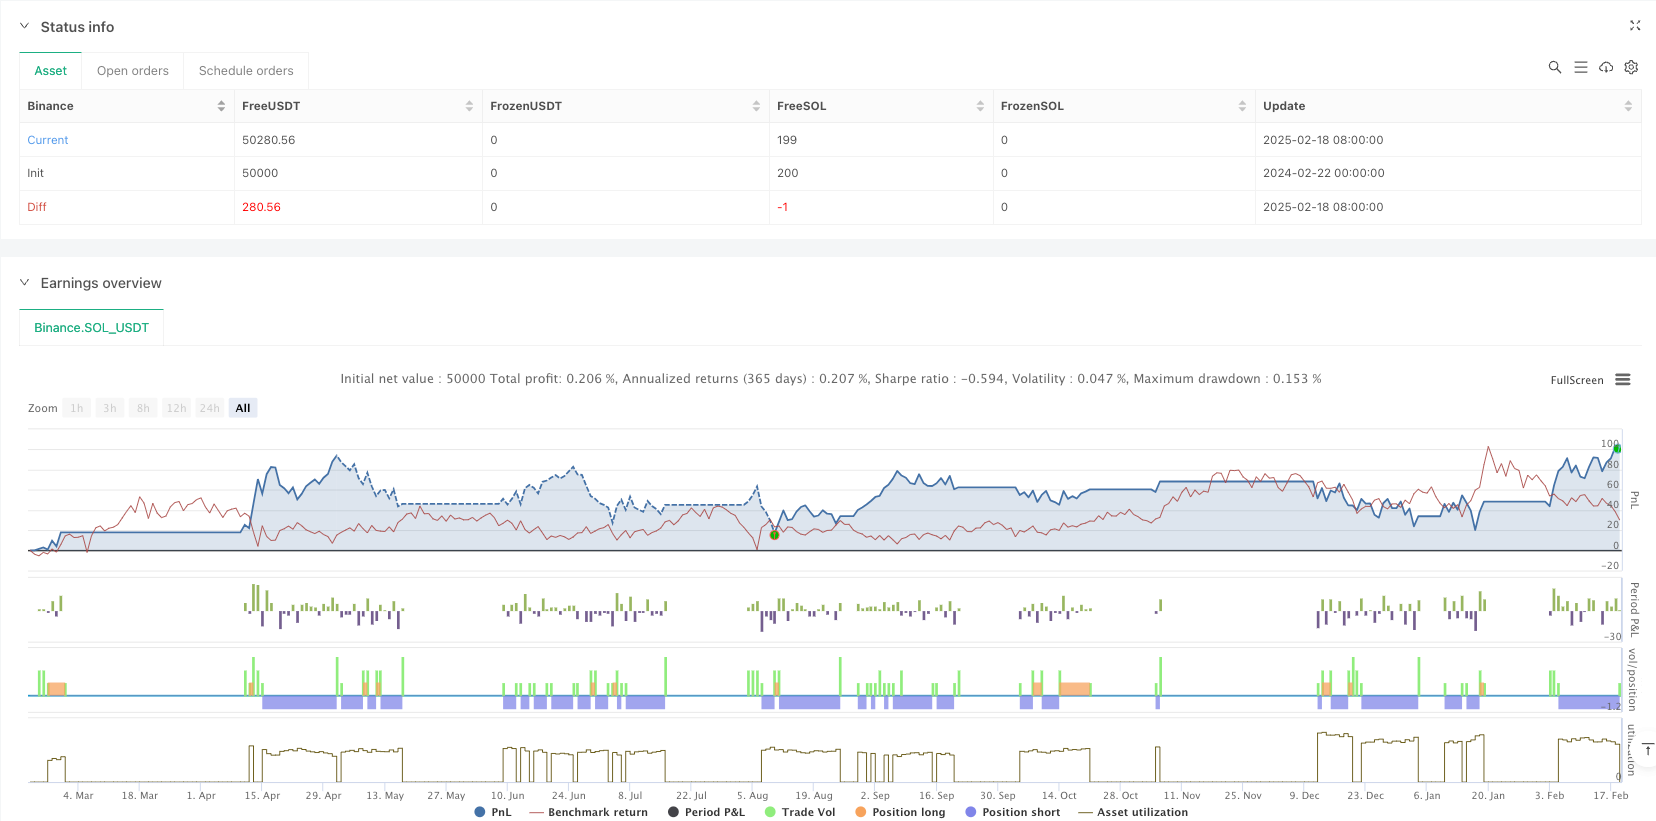
La estrategia es un sistema de comercio de seguimiento de tendencias basado en el índice de movimiento medio de 33 períodos (EMA). Identifica los cambios en la tendencia del mercado a través de la relación cruzada entre el precio y la EMA, y combina los altos y bajos de la oscilación para establecer una posición de stop loss para permitir el seguimiento dinámico de la tendencia y el control del riesgo.
Principio de estrategia
La lógica central de la estrategia es determinar la dirección de la tendencia observando la relación cruzada entre el precio y el EMA de 33 ciclos. Cuando el precio de cierre se cierra hacia arriba y se estabiliza en el EMA, se activa una señal de brecha; cuando el precio de cierre se cierra hacia abajo y se cae en el EMA, se activa una señal de brecha.
Ventajas estratégicas
- La claridad de la señal: Utilice el cruce de EMA como señal de negociación para juzgar la claridad objetiva de los parámetros y evitar las conjeturas subjetivas.
- Gestión dinámica: ajuste dinámico de la posición de parada de pérdidas a las características de fluctuación del mercado a través de la oscilación de los puntos altos y bajos.
- El riesgo es controlado: cada operación tiene una posición de stop loss clara que permite controlar el riesgo de manera efectiva.
- Seguimiento de tendencias: las características de tendencias de la EMA permiten una mejor comprensión de las tendencias a medio y largo plazo.
- Optimización de parámetros: los parámetros clave se pueden ajustar para facilitar la optimización según las diferentes características del mercado.
Riesgo estratégico
- Pérdidas en mercados de oscilación: en mercados de oscilación horizontal, el cruce frecuente puede causar pérdidas continuas.
- Riesgo de retraso: La EMA está un poco atrasada y puede perder puntos importantes en el inicio de la tendencia.
- Riesgo de falsa ruptura: las fluctuaciones de precios a corto plazo pueden causar falsas rupturas y provocar señales erróneas.
- Paramiento: utiliza los límites de fluctuación como punto de parada, en algunos casos el paramiento puede ser mayor.
Dirección de optimización de la estrategia
- Introducción de filtros de tendencia: se puede agregar una línea media o un indicador de tendencia de mayor duración para filtrar las señales de comercio de los mercados de crisis.
- Mejorar el tiempo de entrada: en combinación con indicadores de oscilación como el RSI, entrar en una posición de precio más favorable.
- Optimización de la configuración de frenado: se puede considerar el uso de ATR para ajustar dinámicamente la distancia de frenado, lo que hace que el control del viento sea más flexible.
- Aumentar la confirmación de tráfico: añadir análisis de tráfico para mejorar la fiabilidad de la señal.
- Mecanismos de salida mejorados: diseño de condiciones de salida más detalladas, como la introducción de paradas móviles.
Resumir
Esta es una estrategia de seguimiento de tendencias estructurada y con claridad lógica. Captura de tendencias por medio de la captura cruzada de EMA, maneja el riesgo con los puntos altos y bajos de la volatilidad, y tiene una buena utilidad. Aunque hay algunas limitaciones inherentes, la estabilidad y la rentabilidad de la estrategia se pueden mejorar aún más mediante la dirección de optimización recomendada.
/*backtest
start: 2024-02-22 00:00:00
end: 2025-02-19 08:00:00
period: 1d
basePeriod: 1d
exchanges: [{"eid":"Binance","currency":"SOL_USDT"}]
*/

// This Pine Script™ code is subject to the terms of the Mozilla Public License 2.0 at https://mozilla.org/MPL/2.0/
// © GlenMabasa

//@version=6
strategy("33 EMA Crossover Strategy", overlay=true)

// Input for the EMA length
ema_length = input.int(33, title="EMA Length")

// Calculate the 33-day Exponential Moving Average
ema_33 = ta.ema(close, ema_length)

// Plot the 33 EMA
plot(ema_33, color=color.blue, title="33 EMA", linewidth=2)

// Buy condition: Price crosses and closes above the 33 EMA
buy_condition = ta.crossover(close, ema_33) and close > ema_33

// Sell condition: Price crosses or closes below the 33 EMA
sell_condition = ta.crossunder(close, ema_33) or close < ema_33

// Swing high and swing low calculations
swing_high_length = input.int(14, title="Swing High Lookback")
swing_low_length = input.int(14, title="Swing Low Lookback")
swing_high = ta.highest(high, swing_high_length) // Previous swing high
swing_low = ta.lowest(low, swing_low_length)    // Previous swing low

// Profit target and stop loss for buys
buy_profit_target = swing_high
buy_stop_loss = swing_low

// Profit target and stop loss for sells
sell_profit_target = swing_low
sell_stop_loss = swing_high

// Plot buy and sell signals
plotshape(series=buy_condition, title="Buy Signal", location=location.belowbar, color=color.green, style=shape.labelup, text="BUY")
plotshape(series=sell_condition, title="Sell Signal", location=location.abovebar, color=color.red, style=shape.labeldown, text="SELL")

// Strategy logic for backtesting
if (buy_condition)
    strategy.entry("Buy", strategy.long)
    strategy.exit("Take Profit/Stop Loss", "Buy", limit=buy_profit_target, stop=buy_stop_loss)

if (sell_condition)
    strategy.entry("Sell", strategy.short)
    strategy.exit("Take Profit/Stop Loss", "Sell", limit=sell_profit_target, stop=sell_stop_loss)