Estrategia de trading de tendencia adaptativa con fusión de múltiples indicadores

Resumen
Esta estrategia es un sistema de trading de seguimiento de tendencia adaptativo que integra múltiples indicadores técnicos. Combina el sistema de medias móviles (EMA), el indicador de momento (RSI), el indicador de tendencia (MACD) y SuperTrend para la confirmación de señales, y está equipado con un completo mecanismo de gestión de riesgos que incluye funciones como stop loss, take profit y trailing stop. El diseño de la estrategia tiene en cuenta plenamente la volatilidad del mercado, mejorando la estabilidad y fiabilidad del trading mediante el filtrado de múltiples señales y el control de riesgos.
Principio de la estrategia
La estrategia adopta un mecanismo de confirmación de señales en múltiples capas:
- Determina la dirección inicial de la tendencia mediante el cruce de las EMA de 9 y 21 períodos.
- Utiliza el RSI (14) para filtrar condiciones de sobrecompra/sobreventa: la señal de compra requiere RSI > 40 y < 70, la señal de venta requiere RSI < 60 y > 30.
- El indicador MACD verifica el momento de la tendencia, exigiendo que la línea de señal y la línea MACD tengan la misma dirección.
- El indicador SuperTrend proporciona una confirmación adicional de la tendencia.
- El control de riesgos emplea un stop loss del 5%, un take profit del 10%, un trailing stop del 2% y un punto de equilibrio del 1%.
Solo cuando se cumplen todas las condiciones simultáneamente se activa una señal de trading, lo que reduce eficazmente el riesgo de falsas rupturas.
Ventajas de la estrategia
- El mecanismo de confirmación de múltiples señales reduce significativamente las interferencias de señales falsas.
- Sistema completo de control de riesgos que incluye stop loss fijo, trailing stop y stop de equilibrio.
- La estrategia tiene buena adaptabilidad y puede ajustarse a diferentes entornos de mercado.
- La lógica de entrada y salida es clara, fácil de entender y mantener.
- La lógica de trading tiene una sólida base teórica, cada indicador cumple una función específica.
Riesgos de la estrategia
- La confirmación de múltiples señales puede provocar la pérdida de algunas oportunidades de trading importantes.
- En mercados con fuertes fluctuaciones, los niveles de stop loss fijos pueden no ser lo suficientemente flexibles.
- La optimización de parámetros puede generar un sobreajuste a datos históricos.
- Múltiples indicadores pueden generar señales contradictorias en mercados laterales.
Las soluciones incluyen: ajustar dinámicamente los parámetros de stop loss, introducir indicadores de volatilidad y reoptimizar los parámetros periódicamente.
Direcciones de optimización de la estrategia
- Introducir un mecanismo de parámetros adaptativos que ajuste dinámicamente los parámetros según la volatilidad del mercado.
- Añadir indicadores de volumen como herramienta de confirmación auxiliar.
- Optimizar el mecanismo de stop loss introduciendo un stop loss dinámico basado en ATR.
- Incorporar un módulo de identificación del entorno de mercado para usar diferentes combinaciones de parámetros en distintas condiciones del mercado.
- Desarrollar un sistema de optimización de parámetros basado en aprendizaje automático.
Resumen
Esta estrategia construye un sistema de trading robusto mediante la coordinación de múltiples indicadores técnicos. Su completo mecanismo de control de riesgos y su clara lógica de trading le otorgan una buena utilidad práctica. Aunque existe cierto margen de optimización, el marco básico de la estrategia cuenta con una sólida base teórica. Mediante una optimización y mejora continuas, se espera potenciar aún más su rendimiento de trading.
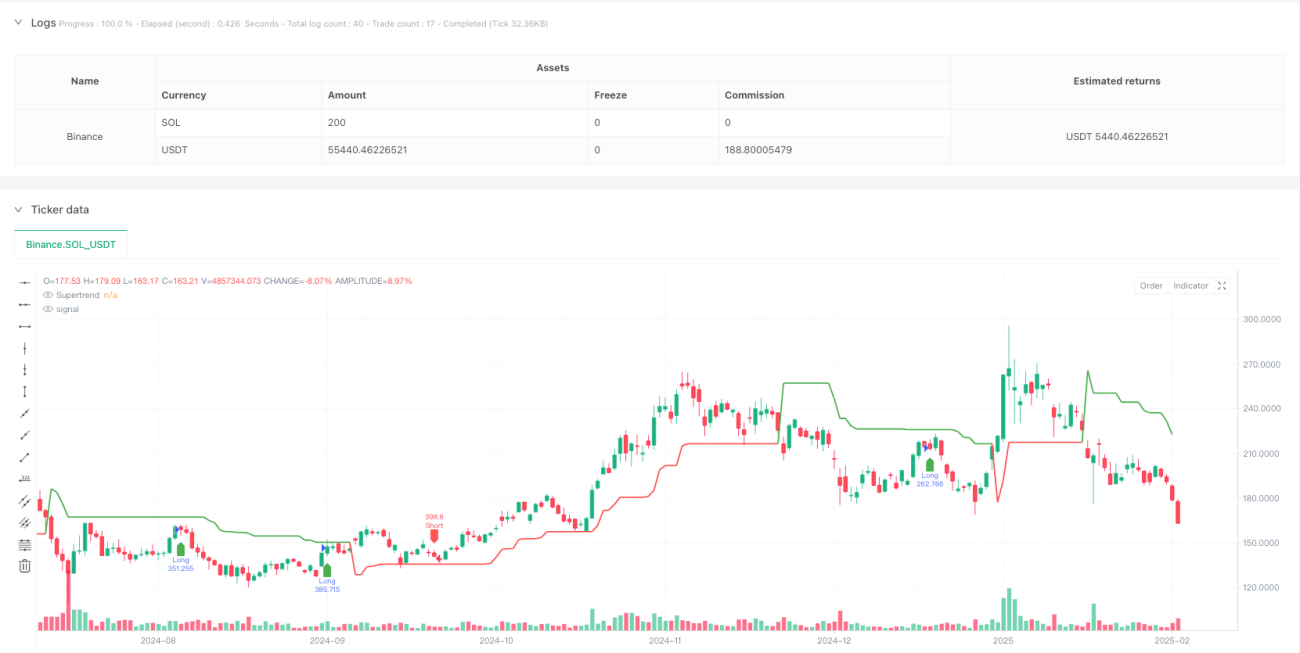
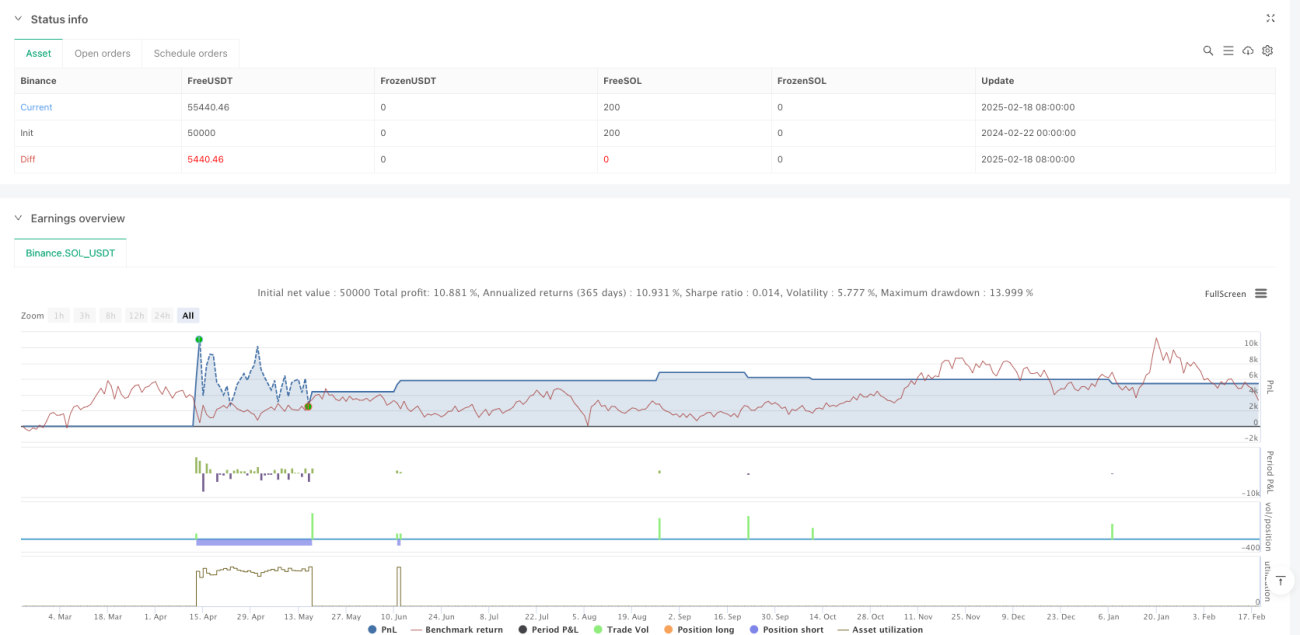
/*backtest
start: 2024-02-22 00:00:00
end: 2025-02-19 08:00:00
period: 1d
basePeriod: 1d
exchanges: [{"eid":"Binance","currency":"SOL_USDT"}]
*/

//@version=5
strategy("Optimized BTC Trading Strategy v2", overlay=true, default_qty_type=strategy.percent_of_equity, default_qty_value=100, commission_type=strategy.commission.percent, commission_value=0.1)

// Input parameters- 1