Sistema inteligente de comercio de tendencias adaptativo multidimensional

Descripción general
La estrategia es un sistema de negociación inteligente que combina múltiples indicadores tecnológicos para identificar oportunidades de mercado a través de un análisis integral de la brecha de valor justo (FVG), las señales de tendencia y el comportamiento de los precios. El sistema utiliza un mecanismo de doble estrategia, que combina el seguimiento de tendencias y las características de las transacciones de banda, para optimizar el rendimiento de las operaciones a través de la gestión dinámica de la posición y el mecanismo de salida multidimensional.
Principio de estrategia
La lógica central de la estrategia se basa en las siguientes dimensiones:
- Identificación de la brecha FVG - Buscar oportunidades potenciales de negociación calculando el tamaño de la brecha de salto de precios
- Sistema de confirmación de tendencias - combina la media diaria de 200 días, el indicador SuperTrend y el MACD para confirmar las tendencias del mercado
- Confirmación de fondos inteligentes - utiliza el RSI para sobrecomprar, sobreventa, anomalías en el volumen de transacciones y patrones de comportamiento de precios como condiciones de activación de transacciones
- Gestión de posiciones dinámica - fluctuaciones basadas en el ATR para ajustar el tamaño de la posición y garantizar la consistencia de la abertura de riesgo
- Mecanismo de salida multicapa - Gestión de la salida de la operación mediante la combinación de seguimiento de stop loss y stop loss objetivo
Ventajas estratégicas
- Adaptabilidad: la estrategia puede ajustar automáticamente los parámetros y las posiciones en función de la volatilidad del mercado
- Control de riesgo perfecto - control de riesgo a través de múltiples filtros y una estricta gestión de posiciones
- La calidad de la señal es fiable - mejora la precisión de las señales de negociación mediante la confirmación de indicadores multidimensionales
- Modos de negociación flexibles - captura de tendencias y oportunidades de fluctuaciones al mismo tiempo
- La ciencia de la gestión de fondos - La gestión del riesgo porcentual para garantizar la racionalidad de la utilización de los fondos
Riesgo estratégico
- Sensibilidad de los parámetros - la configuración de varios parámetros puede afectar el rendimiento de la estrategia y requiere optimización continua
- Dependencia del entorno del mercado - puede haber falsas brechas en ciertos entornos del mercado
- Efecto de deslizamiento - los mercados con menos liquidez pueden enfrentar deslizamientos más grandes
- Complejidad de los cálculos - el cálculo de múltiples indicadores puede causar retrasos en la señal
- Requisitos financieros más elevados: la implementación completa de la estrategia requiere una mayor cantidad de capital inicial
Dirección de optimización de la estrategia
- Optimización de las ponderaciones de los indicadores - Se puede introducir un método de aprendizaje automático para ajustar dinámicamente las ponderaciones de los indicadores
- Mejora de la adaptabilidad del mercado - Mecanismo de adaptación para aumentar la volatilidad del mercado
- Mejoras en la filtración de señales - introducción de más indicadores de la microestructura del mercado
- Mecanismos de ejecución optimizados - Mecanismos de división de pedidos inteligentes para reducir los costos de impacto
- Actualización de los controles de riesgo - Aumento de un sistema dinámico de gestión de presupuestos de riesgo
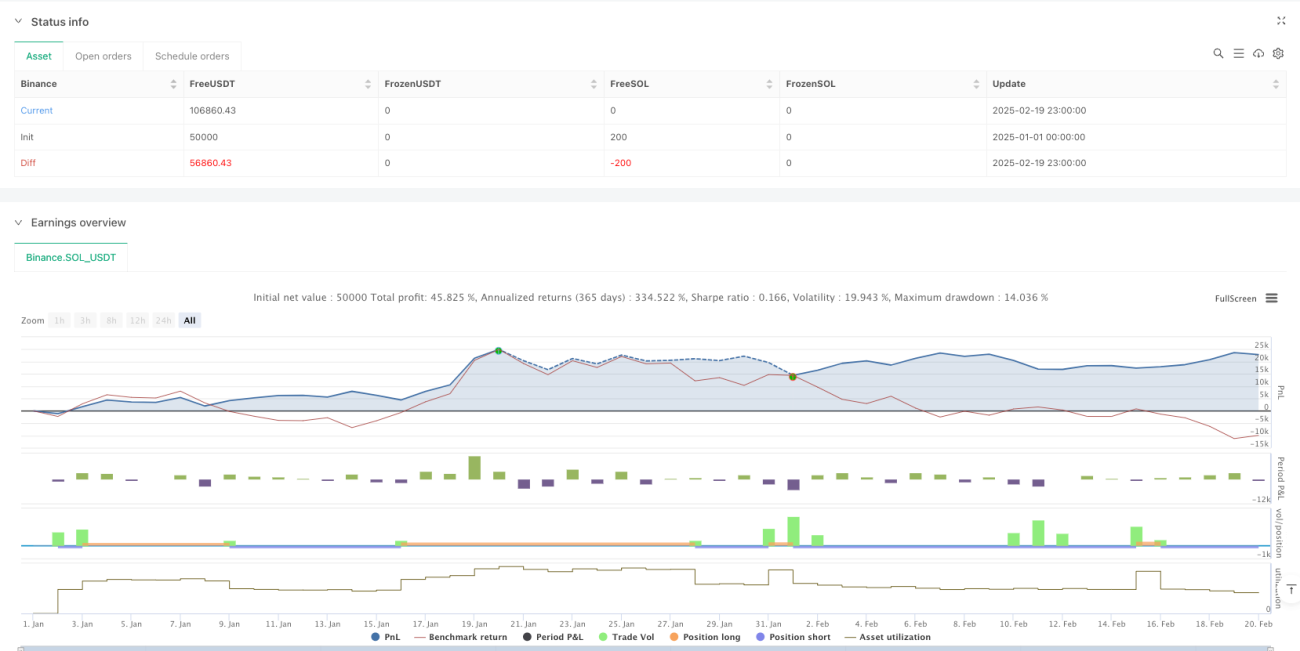
Resumir
La estrategia utiliza una combinación de indicadores técnicos y técnicas de negociación para construir un sistema de negociación completo. Su ventaja radica en la capacidad de adaptarse a los cambios en el mercado, mientras se mantiene un control estricto del riesgo. Aunque hay cierto espacio para la optimización, en general, es una estrategia de negociación cuantitativa de diseño razonable.
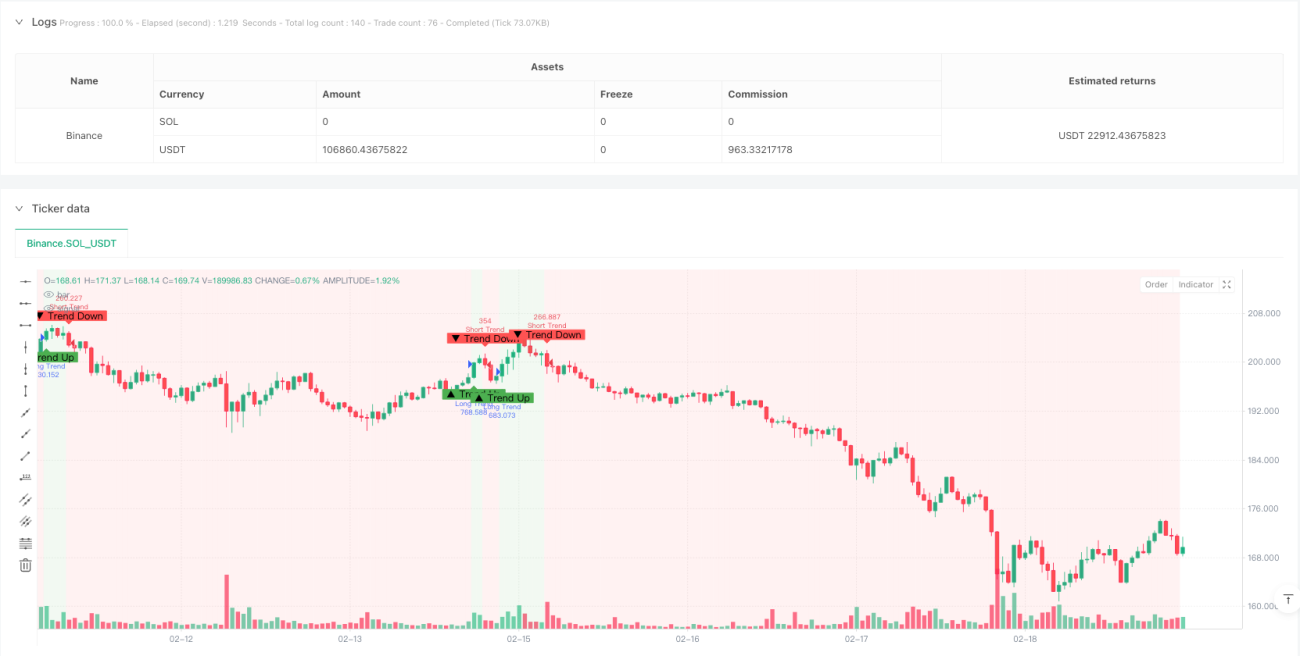
/*backtest
start: 2025-01-01 00:00:00
end: 2025-02-20 00:00:00
period: 1h
basePeriod: 1h
exchanges: [{"eid":"Binance","currency":"SOL_USDT"}]
*/

//@version=6
strategy("Adaptive Trend Signals", overlay=true, margin_long=100, margin_short=100, pyramiding=1, initial_capital=50000, default_qty_type=strategy.percent_of_equity, default_qty_value=100, commission_type=strategy.commission.percent, commission_value=0.075)

// 1. Enhanced Inputs with Debugging Options- 1