
Descripción general
Esta estrategia es un sistema de negociación basado en análisis de múltiples períodos de tiempo, que utiliza principalmente el intervalo de precios centrales (CPR), el promedio móvil del índice (EMA) y el indicador de fuerza relativa (RSI). La estrategia identifica las tendencias del mercado y los puntos de resistencia de soporte clave a través de los niveles de CPR de la línea diaria, el precio de apertura semanal y el EMA de 20 períodos, y combina la confirmación de volumen de negocios para ejecutar operaciones.
Principio de estrategia
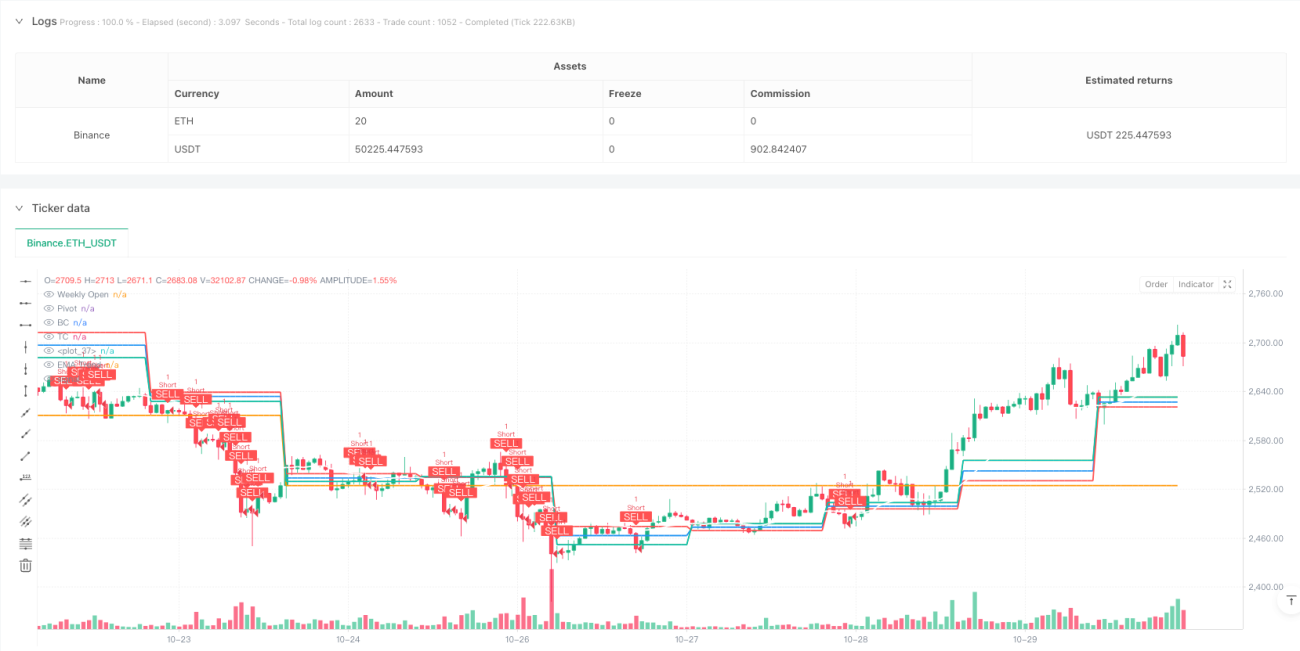
El núcleo de la estrategia es buscar oportunidades de negociación mediante el análisis de la relación entre el precio y el nivel de CPR. La CPR se compone de un punto central central (Pivot), una línea central inferior (BC) y una línea central superior (TC). Cuando el precio supera el TC y el mercado se encuentra en una fase de varios puntos, el sistema emite una señal múltiple; cuando el precio baja el BC y el mercado se encuentra en una fase de vacío, el sistema emite una señal de vacío.
Ventajas estratégicas
- Mecanismo de confirmación múltiple: combina la triple confirmación de la conducta de los precios, la dirección de la tendencia y el volumen de transacción para aumentar la fiabilidad de las señales de negociación
- Gestión de riesgos dinámica: Detención de pérdidas dinámicas basadas en la amplitud de CPR, adaptada a diferentes entornos de mercado
- Opciones de personalización flexibles: Se puede ajustar el ciclo de tiempo de CPR, la duración de EMA y el encendido/apagado de la confirmación de desviación RSI
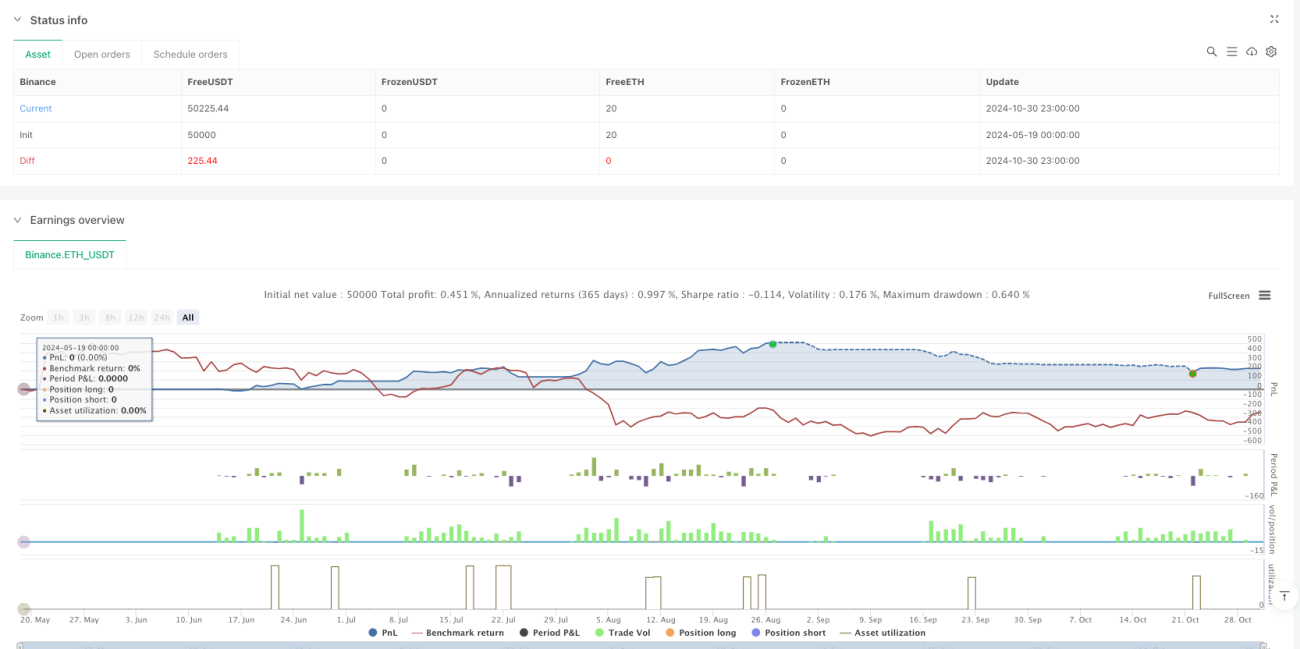
- Asimetría de la relación de ganancias: con una relación de ganancias y riesgos de 1.5:1, mejora la rentabilidad a largo plazo
- Análisis multi-temporal: proporciona una visión más completa del mercado mediante la integración de datos de la línea de sol y de la línea de sol
Riesgo estratégico
- Riesgo de brechas falsas: Se sugiere el uso de condiciones de filtración de volumen de transacción más estrictas debido a la posibilidad de señales de brechas falsas en mercados convulsos.
- Riesgo de reversión de la tendencia: puede haber una mayor reversión en los puntos de reversión de la tendencia, el riesgo puede ser controlado mediante la reducción de los límites de parada
- Sensibilidad de parámetros: el rendimiento de la estrategia es sensible a parámetros como la longitud de EMA y el valor de los umbrales de la transacción, que requieren optimización periódica
- Dependencia del entorno del mercado: la relación riesgo-beneficio puede ser difícil de alcanzar en un entorno de baja volatilidad
- Punto de deslizamiento de la ejecución: en el caso de un movimiento rápido, puede haber un punto de deslizamiento mayor que afecte a la efectividad de la operación.
Dirección de optimización de la estrategia
- Introducción de un mecanismo de adaptación de la volatilidad: ajuste de los objetivos de detención de pérdidas y ganancias en función de la dinámica de la volatilidad del mercado
- Aumentar la clasificación de los estados de mercado: segmentar las tendencias y recopilar los mercados con diferentes parámetros de transacción
- Optimización del filtro de tráfico: considera los cambios en el volumen de tráfico relativo en lugar de una simple comparación de medias
- Mecanismo de salida mejorado: aumento de la función de stop loss móvil y ciertas ganancias
- El filtro de tiempo de inclusión: evitar el comercio en períodos de tiempo específicos, como los períodos de alta volatilidad antes y después de la apertura y el cierre del mercado
Resumir
Se trata de una estrategia de seguimiento de tendencias estructurada y con claridad lógica, que controla eficazmente el riesgo de negociación mediante el uso combinado de múltiples indicadores técnicos. La principal ventaja de la estrategia reside en su configuración de parámetros flexibles y su mecanismo de gestión de riesgos completo, pero al mismo tiempo requiere que los operadores estén atentos a los cambios en el entorno del mercado y ajusten los parámetros de la estrategia a tiempo.
//@version=5
strategy("Ahmad Ali Khan CPR Strategy", overlay=true, margin_long=100, margin_short=100)

// ———— Inputs ————
use_daily_cpr = input.bool(true, "Use Daily CPR Levels")
ema_length = input.int(20, "EMA Trend Filter Length")
show_week_open = input.bool(true, "Show Weekly Open Price")
enable_divergence = input.bool(true, "Enable RSI Divergence Check")

// ———— Daily CPR Calculation ————
daily_high = request.security(syminfo.tickerid, "D", high[1], lookahead=barmerge.lookahead_on)
daily_low = request.security(syminfo.tickerid, "D", low[1], lookahead=barmerge.lookahead_on)- 1