
Descripción general
La estrategia es un sistema de trading de seguimiento de tendencias basado en la ruptura del canal Donchian, que combina un indicador de tendencia super (SuperTrend) y un filtro de volumen de transacción para aumentar la fiabilidad de la señal de negociación. La estrategia identifica oportunidades de negociación potenciales de múltiples direcciones capturando los máximos históricos de los precios, mientras que utiliza la confirmación de volumen de transacción y el indicador de seguimiento de tendencias para filtrar las falsas señales de ruptura.
Principio de estrategia
La lógica central de la estrategia se basa en los siguientes componentes clave:
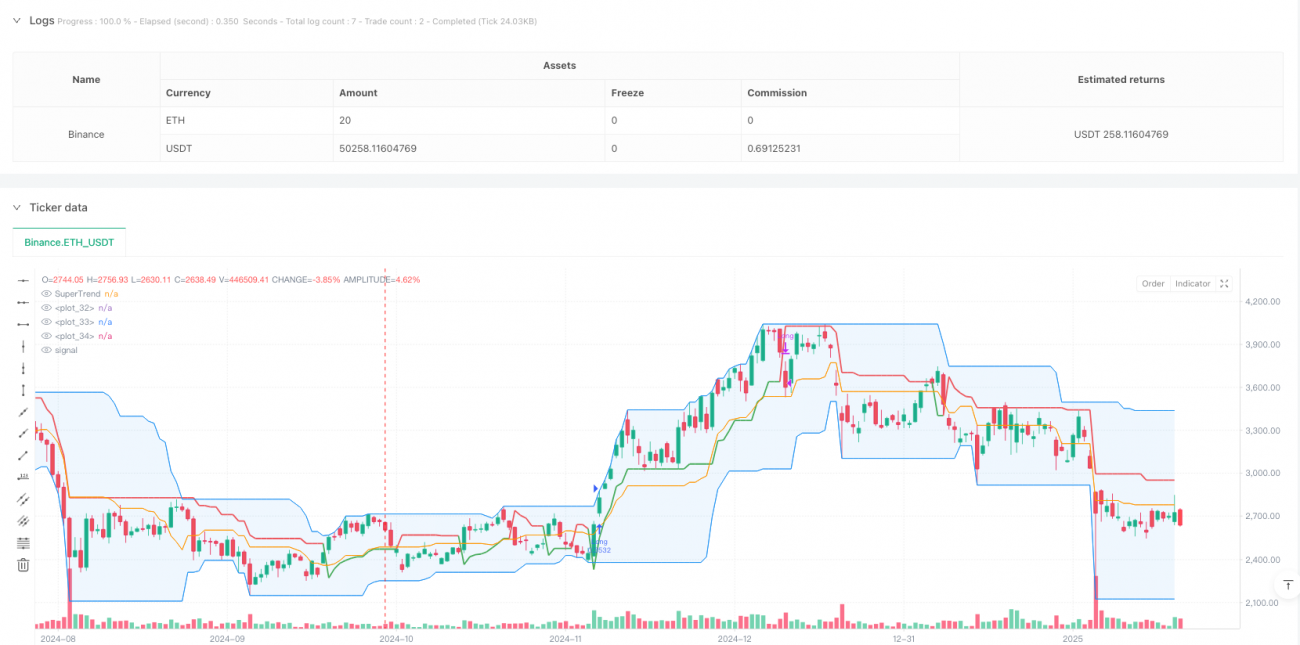
- El canal de Dongjian: calcula los precios máximos y mínimos dentro de un ciclo definido por el usuario, formando trayectorias altas, bajas y medias. Cuando el precio se rompe en altas, se activa una señal de entrada múltiple.
- Filtrador de transacciones: mejora la fiabilidad de las rupturas al comparar el volumen de transacciones actual con una media móvil de 20 ciclos, asegurando que solo se ingrese cuando el volumen de transacciones aumenta.
- Indicador de tendencia súper: como herramienta de confirmación de tendencias, muestra verde cuando hay tendencias de más de una cabeza y rojo cuando hay tendencias en blanco.
- Mecanismo de pérdida flexible: ofrece cuatro opciones de pérdida diferentes, incluyendo pérdidas de baja vía, pérdidas de media vía, pérdidas de supertrend y pérdidas de seguimiento porcentual.
Ventajas estratégicas
- Confirmación de múltiples señales: Combinación de brechas de precios, confirmación de volúmenes de transacción y indicadores de tendencias para reducir considerablemente el riesgo de falsas brechas.
- Adaptabilidad: Se puede adaptar a diferentes entornos de mercado y ciclos de negociación mediante ajustes de parámetros.
- La gestión de riesgos es perfecta: ofrece varias opciones de pérdidas, que se pueden elegir de acuerdo con las características del mercado.
- Visualización clara: la interfaz de estrategia muestra los indicadores de manera intuitiva para que los operadores puedan comprender el estado del mercado.
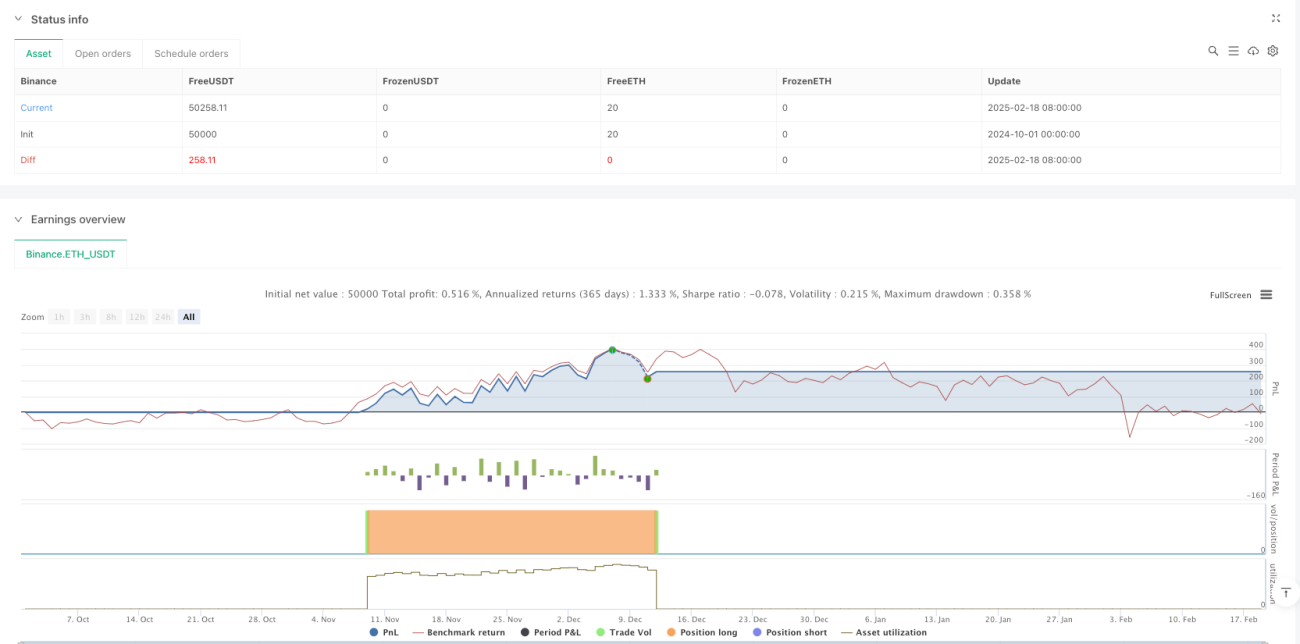
- Flexibilidad en el retorno: permite un rango de tiempo de retorno personalizado para facilitar la optimización de la estrategia.
Riesgo estratégico
- Riesgo de mercado de temblores: puede generar falsas brechas frecuentes en situaciones de temblores intermitentes.
- Riesgo de deslizamiento: en mercados con poca liquidez, las señales de ruptura pueden desviarse del precio de entrada debido al deslizamiento.
- Riesgo de exceso de filtración: El uso de filtros de volumen de transacción puede hacer que se pierdan algunas oportunidades de negociación efectivas.
- Sensibilidad de los parámetros: el efecto de la estrategia es sensible a la configuración de los parámetros y requiere una optimización cuidadosa.
Dirección de optimización de la estrategia
- Aumentar el filtro de intensidad de tendencia: se puede agregar un indicador de intensidad de tendencia como ADX, que solo entra en juego cuando la tendencia es fuerte.
- Optimización de los indicadores de tráfico: se puede considerar el uso de un indicador de tráfico relativo o un indicador de tráfico de ruptura en lugar de una media móvil simple.
- Añadir filtro de tiempo: añadir la configuración de la ventana de tiempo de negociación para evitar los momentos de mayor volatilidad del mercado.
- Optimización de parámetros dinámicos: ajuste automático de los ciclos de canal y los parámetros de supertrend en función de la volatilidad del mercado.
- Introducción al aprendizaje automático: optimización de la selección de parámetros y filtración de señales con algoritmos de aprendizaje automático.
Resumir
La estrategia utiliza varios indicadores técnicos para construir un sistema de seguimiento de tendencias relativamente completo. La estrategia tiene la ventaja de una alta fiabilidad de la señal y la flexibilidad para administrar el riesgo, pero aún requiere que el comerciante optimice los parámetros de acuerdo con las características específicas del mercado.
- 1