Estrategia de trading adaptativa de cuadrícula de Bollinger

Descripción general
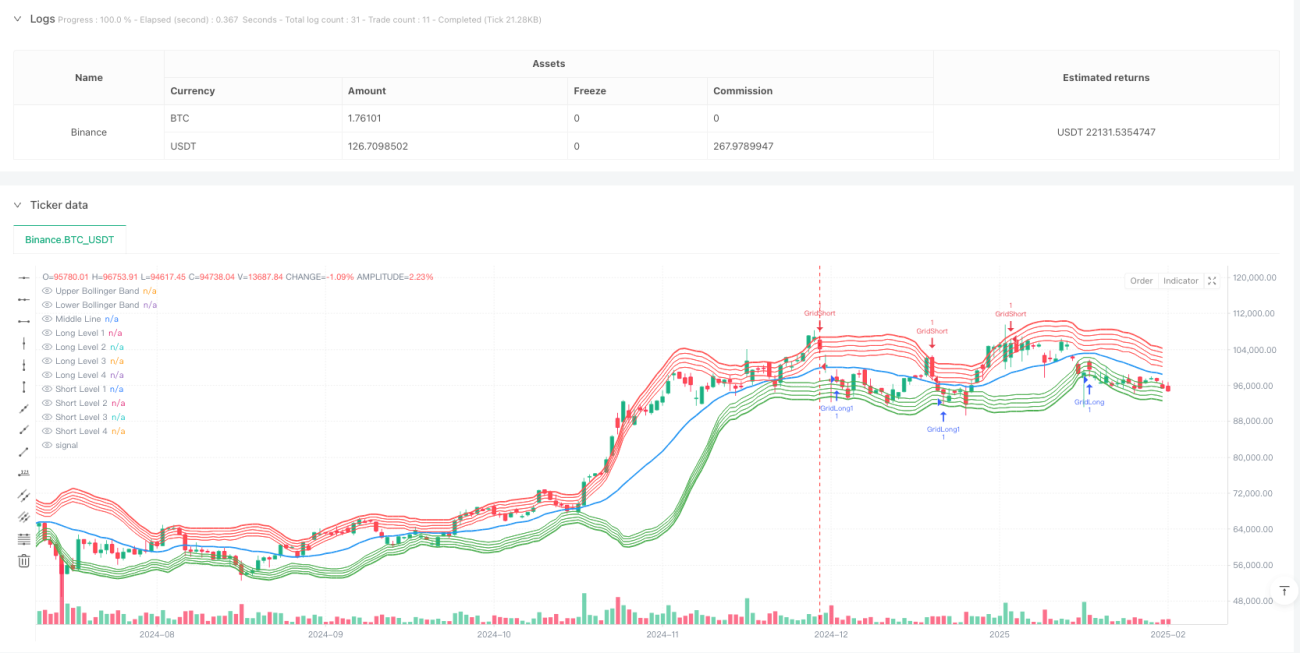
Esta es una estrategia de trading de grilla avanzada basada en indicadores de la banda de Brin. Esta estrategia determina la posición de la grilla a través de la dinámica de la banda de Brin, y ajusta automáticamente el intervalo de la grilla en función de la volatilidad del mercado. El sistema ejecuta las operaciones de múltiples espacios correspondientes cuando el precio rompe la línea de la grilla, lo que permite una operación de grilla totalmente automatizada.
Principio de estrategia
La estrategia utiliza una media móvil de 20 ciclos como el medio de la banda de burin, y dos veces la diferencia estándar como el ancho de banda. En la base de la banda de burin, la estrategia establece 4 niveles de red entre las líneas de arriba y abajo, con un intervalo de red del 1%. Cuando el precio se rompe hacia arriba una línea de la red, el sistema ejecuta varias operaciones; cuando el precio se rompe hacia abajo una línea de la red, el sistema ejecuta una operación de vacío. Este diseño permite que la estrategia se mantenga rentable en un mercado inestable.
Ventajas estratégicas
- Ajuste dinámico: la posición de la cuadrícula se mueve con la banda de Brin, lo que permite que las estrategias se adapten a diferentes entornos de mercado
- Control de riesgos - Limitación de la zona de negociación a través de la franja de Brin para evitar una posición excesiva en situaciones extremas
- Alta automatización - el sistema ejecuta las transacciones automáticamente sin intervención humana
- El comercio bidireccional - puede ser rentable tanto en alzas como en bajas
- Parámetros ajustables - el espacio entre las rejillas y el número de niveles se pueden ajustar con flexibilidad según sea necesario
Riesgo estratégico
- Riesgo de mercado de tendencia - puede producirse un mayor retroceso en una tendencia unilateral
- Riesgo de gestión de fondos: la activación simultánea de varias redes puede provocar una sobrecarga de posiciones
- Riesgo de deslizamiento: los precios de transacción pueden desviarse del precio de la red cuando el mercado fluctúa fuertemente.
- Riesgo tecnológico: Falsa señal de ruptura en la banda de Brin
Solución:
- Establecimiento de un límite de tenencia total
- Introducción de un filtro de tendencias
- Mecanismo de ejecución de pedidos optimizado
- Se añaden filtros de confirmación
Dirección de optimización de la estrategia
- Distancia de la rejilla adaptativa - Ajuste dinámico de la distancia de la rejilla según la tasa de fluctuación
- Introducción de la relación entre el precio y la cantidad - la combinación de indicadores de volumen de negocios para optimizar la entrada en el mercado
- Optimización de los mecanismos de detención de pérdidas - diseño de soluciones de detención más flexibles
- Optimización de la gestión de fondos: gestión de posiciones basada en el riesgo
- Sincronización de ciclo de tiempo múltiple - introducción de mecanismos de confirmación de señal múltiple
Resumir
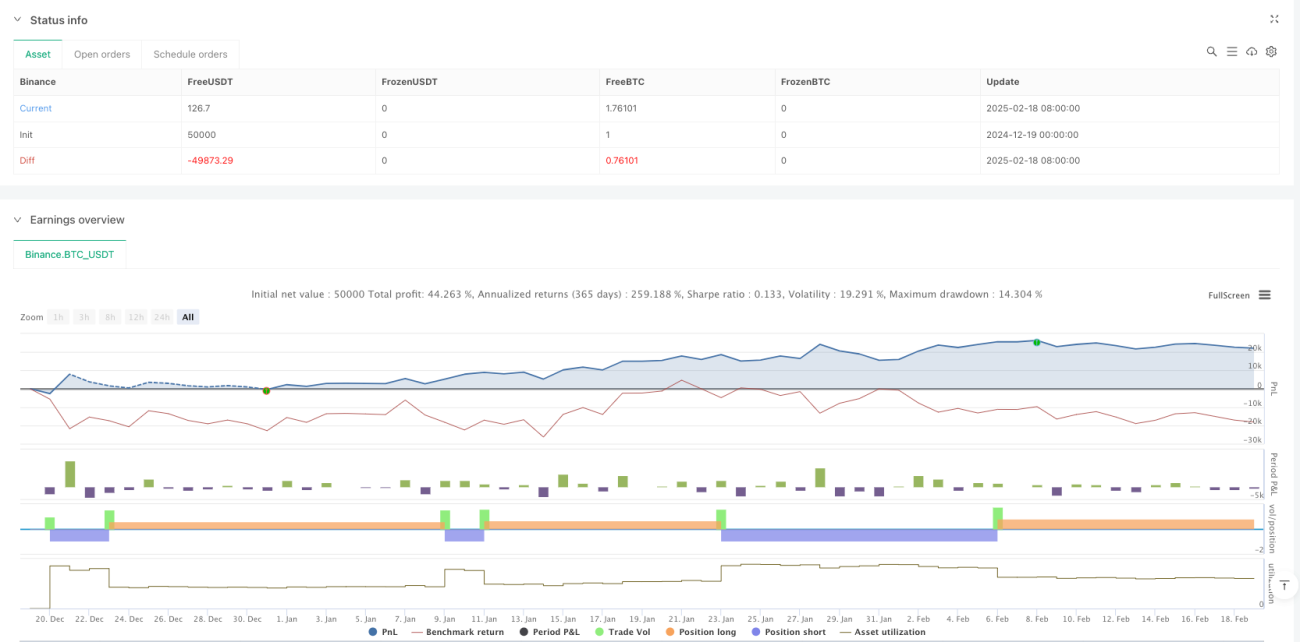
La estrategia, a través de la combinación de las transacciones de la banda de Brin y de la red, permite un sistema de comercio automatizado con flexibilidad y estabilidad. La ventaja central de la estrategia es la capacidad de adaptarse a diferentes entornos de mercado, mientras que el control del riesgo se logra mediante la adaptación de los parámetros. Aunque existen algunos riesgos inherentes, se puede construir un sistema de comercio más robusto mediante la optimización y el perfeccionamiento continuos.
- 1