
Descripción general
Esta estrategia es una estrategia de negociación intradiaria que combina brechas en el rango de precios del día anterior y promedios móviles del índice (EMAs). La estrategia realiza operaciones identificando el momento en que los precios alcanzaron su punto más alto o más bajo el día anterior a la ruptura, combinando señales de confirmación de EMAs rápidos y lentos. La estrategia se centra en capturar movimientos de precios a corto plazo y gestionar el riesgo mediante el establecimiento de un número fijo de puntos de parada y ganancias por riesgo.
Principio de estrategia
La lógica central de la estrategia se basa en los siguientes elementos clave:
- Utiliza la función request.security para obtener los máximos y mínimos del día de negociación anterior como un rango de precios clave.
- Calcular las medias móviles de índices de 9 y 21 períodos (EMAs) como indicadores de confirmación de tendencias.
- Cuando el precio ha alcanzado su punto más alto el día anterior a la ruptura y el EMA rápido está por encima del EMA lento, se activa una señal de multiplicación.
- Cuando el precio se encuentra por debajo de los mínimos del día anterior y el EMA rápido está por debajo del EMA lento, se activa la señal de desvío.
- Gestiona el riesgo de cada transacción estableciendo un número fijo de puntos de stop loss (30 puntos) y un riesgo/beneficio ratio (RRR) de 2.0.
- La función de filtro de tiempo de transacción opcional, que permite realizar transacciones en un período de tiempo específico (zona horaria SAST).
Ventajas estratégicas
- La estructura es clara, la lógica es simple: la estrategia utiliza una lógica de brecha de precios que es fácil de entender y ejecutar.
- Gestión de riesgos: un control estricto de los riesgos mediante la fijación de los puntos de parada y el riesgo-beneficio.
- Gestión de tiempo flexible: la función de filtro de tiempo de negociación opcional permite operar en los momentos más activos del mercado.
- Mecanismo de confirmación múltiple: combina brechas de precios y confirmación de tendencias de EMA para reducir el riesgo de falsas señales.
- Alto grado de automatización: las estrategias pueden ejecutarse de forma totalmente automatizada, con una menor intervención humana.
Riesgo estratégico
- Riesgo de falsa ruptura: el precio puede retroceder rápidamente después de la ruptura, lo que lleva a una parada de pérdidas.
- Riesgo de deslizamiento: durante la alta volatilidad, el precio de transacción real puede estar muy alejado del precio de la señal.
- Riesgo de pérdidas fijas: las pérdidas de puntos fijos pueden no ser adecuadas para todas las condiciones del mercado.
- Riesgo de fluctuaciones en el mercado: Se pueden generar demasiadas señales de negociación durante la baja volatilidad.
Dirección de optimización de la estrategia
- Optimización dinámica de stop loss: se puede considerar ajustar el número de puntos de stop loss en función de la fluctuación dinámica de la tasa de mercado.
- Optimización del tiempo de transacción: Optimización de la configuración de la ventana de tiempo de transacción a través del análisis de datos históricos.
- Mejora de la filtración de la señal: añade un indicador de volumen de tránsito o de fluctuación como condición de filtración adicional.
- Optimización de parámetros de las EMAs: Determinación de la configuración óptima de los EMAs a través de la retroalimentación.
- Optimización de la gestión de posiciones: introducción de un mecanismo de gestión de posiciones dinámico basado en la volatilidad.
Resumir
La estrategia logra un sistema de negociación intraday fiable mediante la combinación de brechas de precios y la confirmación de tendencias de los EMA. La estrategia tiene como ventaja central su clara estructura lógica y su completo mecanismo de gestión de riesgos. La estrategia puede mejorar aún más su estabilidad y rentabilidad a través de la orientación de optimización recomendada.
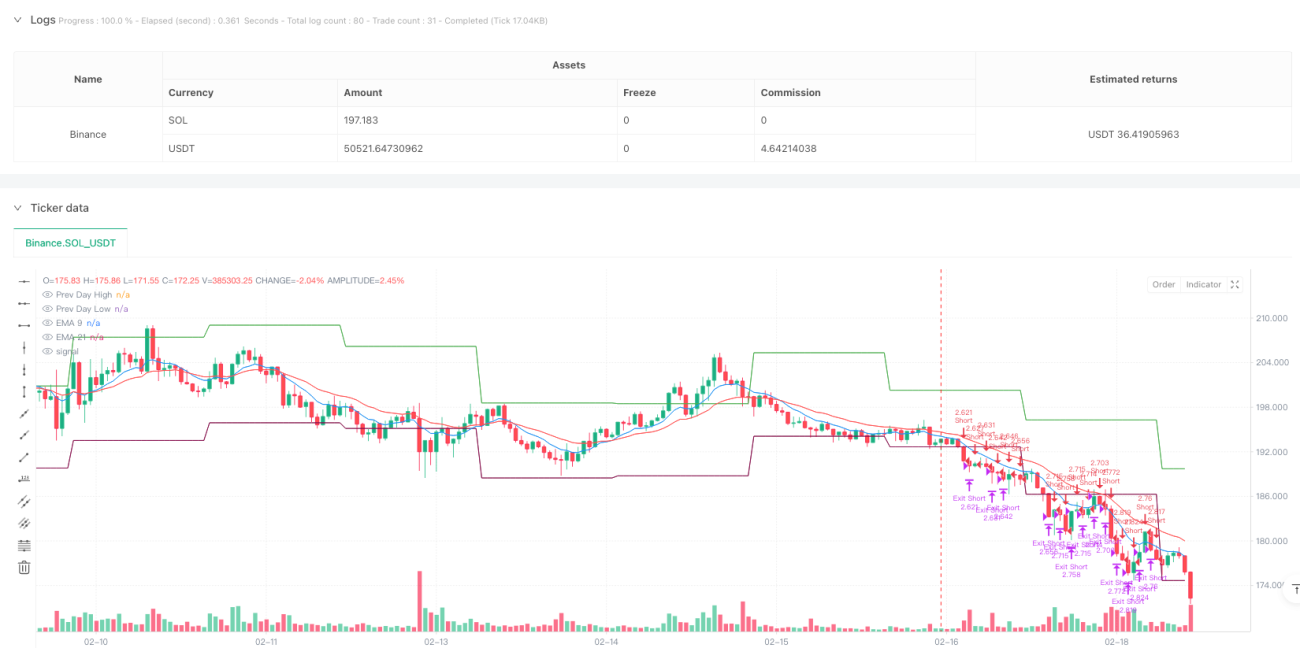
/*backtest
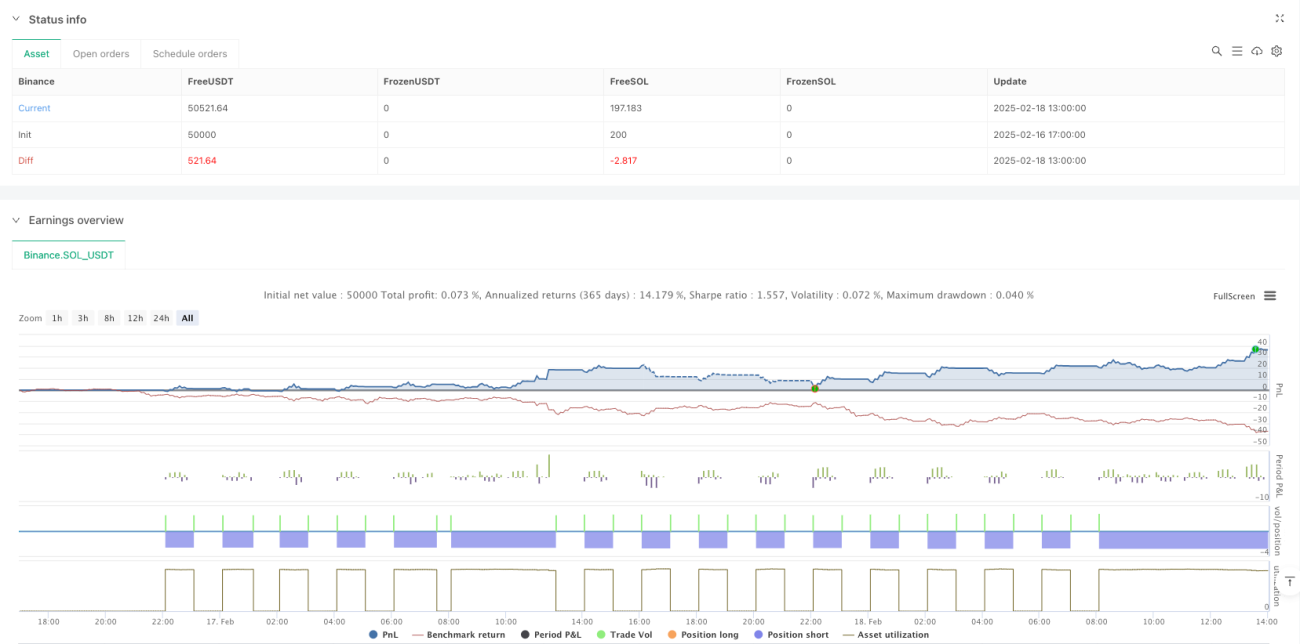
start: 2025-02-16 17:00:00
end: 2025-02-18 14:00:00
period: 1h
basePeriod: 1h
exchanges: [{"eid":"Binance","currency":"SOL_USDT"}]
*/
//@version=5
strategy("GER40 Momentum Breakout Scalping", overlay=true, initial_capital=10000, default_qty_type=strategy.percent_of_equity, default_qty_value=1)
//———— Input Parameters —————- 1