Descripción general
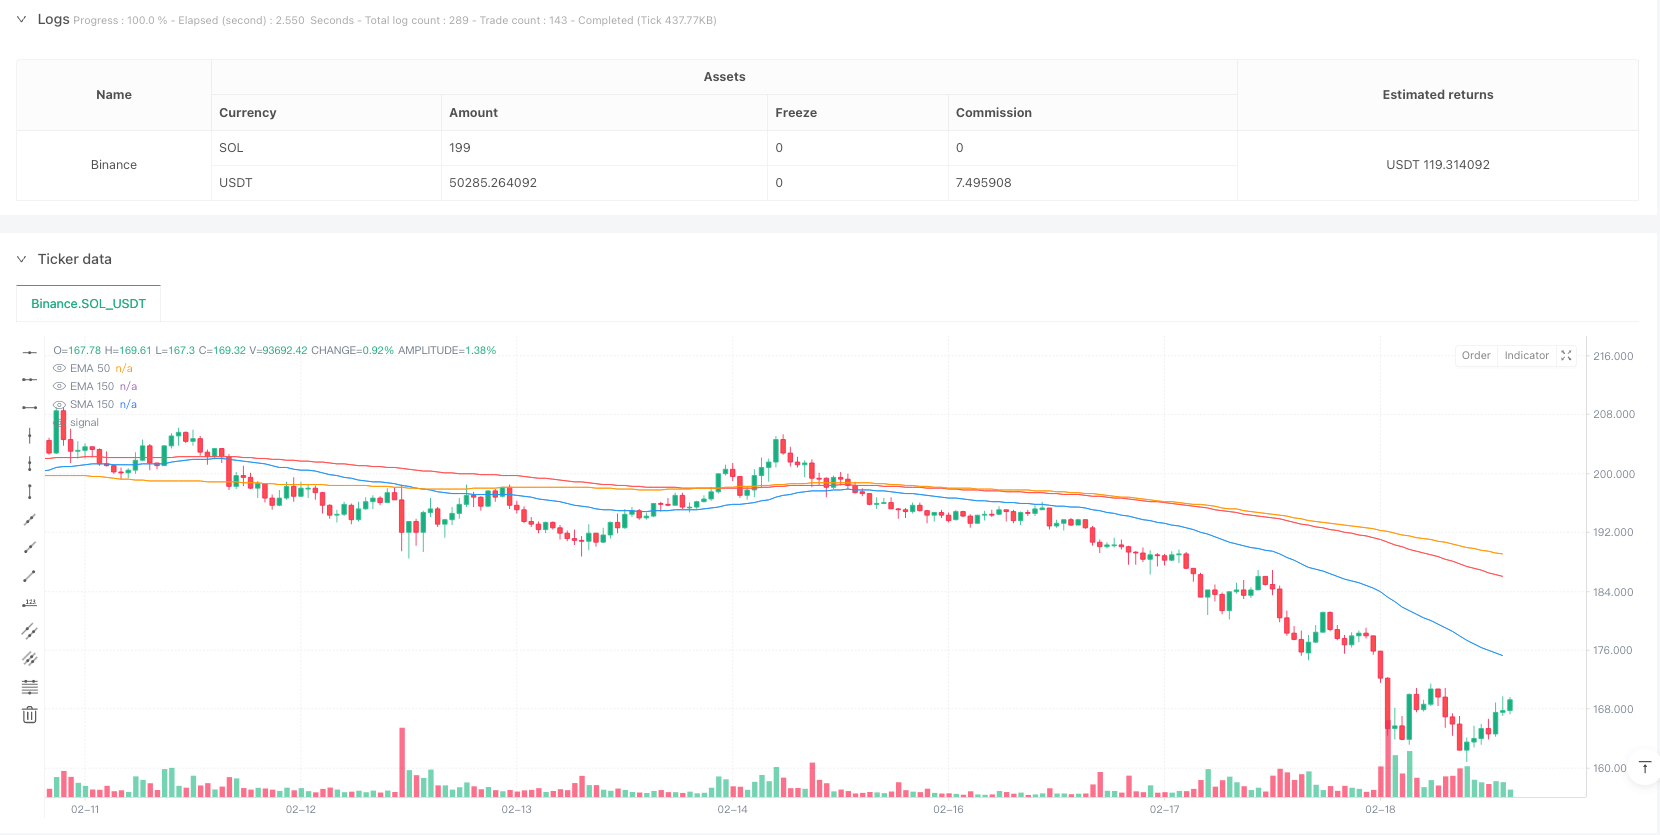
La estrategia es un sistema de trading de seguimiento de tendencias que combina las medias móviles indexadas (EMA) y las medias móviles simples (SMA). La estrategia utiliza principalmente la EMA50 para generar señales de trading cruzadas con la EMA150, mientras que utiliza la SMA150 como línea de parada e incluye un mecanismo de reingreso después de la parada. Este diseño capta tendencias a medio y largo plazo y controla el riesgo de manera efectiva.
Principio de estrategia
La lógica central de la estrategia incluye los siguientes elementos clave:
- La señal de entrada: Cuando el EMA50 cruza el EMA150 hacia arriba, genera una señal de multitarea; Cuando el EMA50 cruza el EMA150 hacia abajo, genera una señal de vacío.
- Mecanismo de stop loss: se activa el stop loss cuando el precio cae por debajo de la SMA 150
- Mecanismo de reingreso: después de activar el stop loss, si el precio vuelve a superar la EMA150, vuelve a entrar; si la EMA50 vuelve a pasar por debajo de la EMA150, la entrada se cancela.
- Ejecución de la operación: la estrategia ejecuta la operación en el período de tiempo indicado y tiene en cuenta la comisión del 0.1% y el punto de deslizamiento de 3 puntos.
Ventajas estratégicas
- La capacidad de seguimiento de tendencias es fuerte: la combinación de líneas medias de diferentes períodos permite capturar de manera efectiva las tendencias del mercado.
- El control de riesgos es perfecto: se establecen condiciones de stop loss claras para evitar pérdidas excesivas.
- El mecanismo de reingreso es flexible: permite la reingreso cuando las condiciones del mercado mejoran, lo que mejora las oportunidades de ganancias.
- La configuración de los parámetros es razonable: la elección de los ciclos EMA50 y EMA150 equilibra la sensibilidad y la estabilidad.
- Tenga en cuenta los costos reales de las transacciones: incluye comisiones y factores de deslizamiento, más cercanos al entorno real de las transacciones.
Riesgo estratégico
- Riesgo de mercado en movimiento: Los mercados en movimiento horizontal pueden generar frecuentemente falsas brechas.
- Riesgo de atraso: El indicador de promedios móviles en sí mismo es retrasado y puede perder el mejor momento de entrada.
- Riesgo de reingreso: en un mercado muy volátil, el mecanismo de reingreso puede causar pérdidas continuas.
- Riesgo de gestión de fondos: la estrategia no incluye un programa específico de gestión de posiciones.
- Dependencia del entorno del mercado: la estrategia puede tener un rendimiento muy diferente en diferentes ciclos de mercado.
Dirección de optimización de la estrategia
- Introducción de indicadores de volatilidad: se puede agregar ATR o Bollinger Bands para ajustar la posición de parada y hacer que la parada sea más adaptable.
- Mejorar la gestión de posiciones: Se recomienda la incorporación de un sistema de gestión de posiciones dinámico basado en la volatilidad.
- Optimización de las condiciones de reingreso: se puede combinar con indicadores de oscilación como el RSI para mejorar la precisión de la señal de reingreso.
- Aumentar el filtro de entornos de mercado: agregar indicadores de intensidad de tendencia y reducir la frecuencia de operaciones en mercados de baja tendencia.
- Desarrollo de parámetros de adaptación: se puede ajustar dinámicamente el ciclo de la línea media en función de la volatilidad del mercado.
Resumir
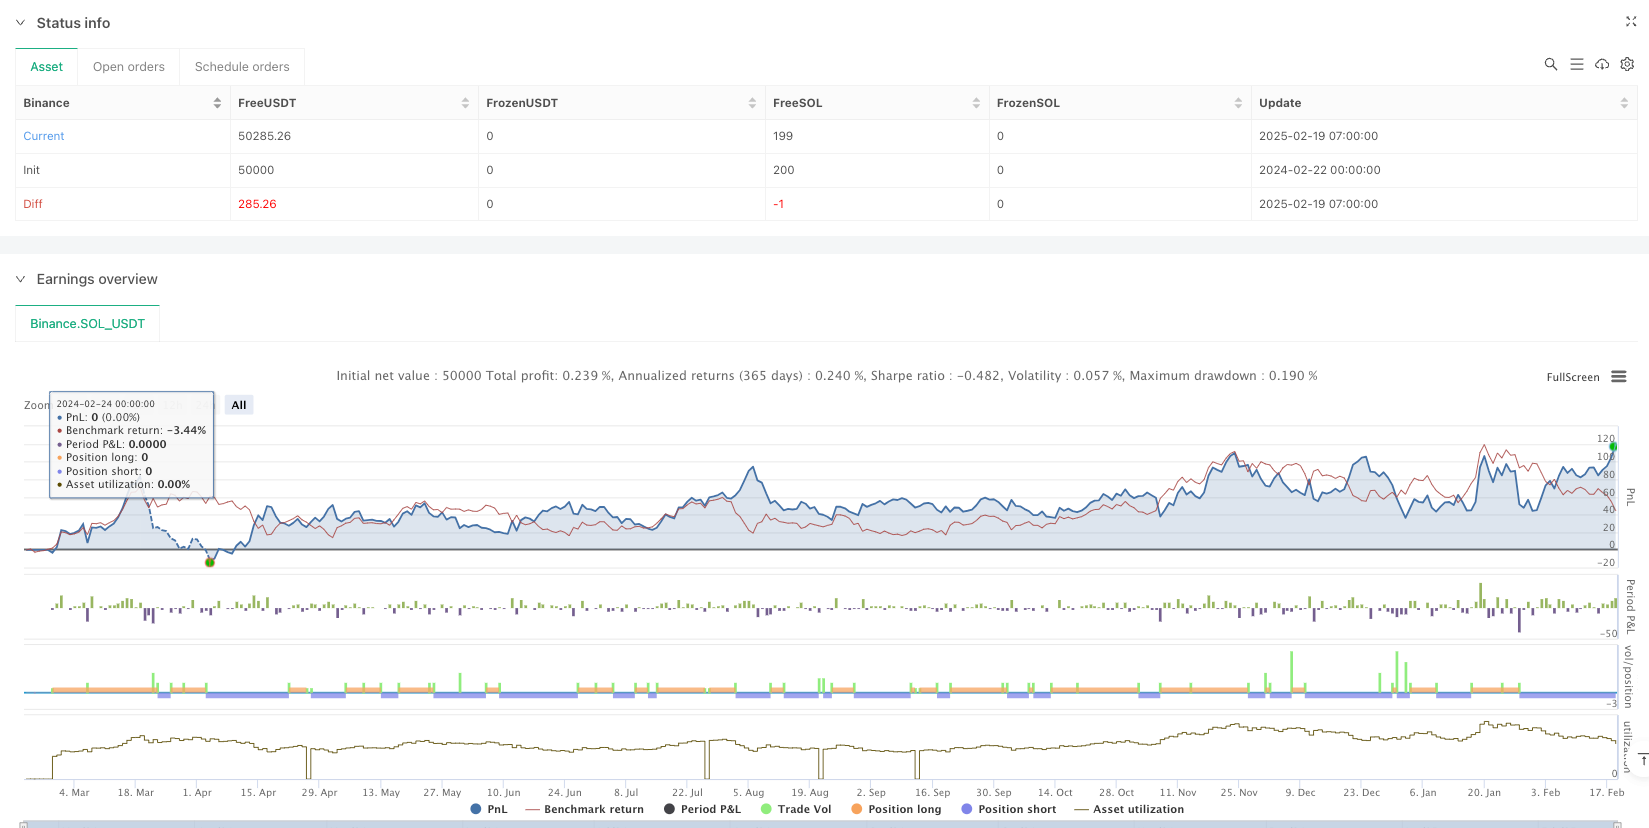
Se trata de una estrategia de seguimiento de tendencias de diseño razonable, que capta las tendencias a través de la cruz de la línea de la igualdad, y está equipada con un mecanismo de control de riesgos completo. La principal ventaja de la estrategia reside en la capacidad de seguimiento de tendencias del sistema y el diseño de gestión de riesgos, pero en la aplicación real se debe tener en cuenta el impacto del entorno del mercado en el rendimiento de la estrategia.
/*backtest
start: 2024-02-22 00:00:00
end: 2025-02-19 08:00:00
period: 1h
basePeriod: 1h
exchanges: [{"eid":"Binance","currency":"SOL_USDT"}]
*/

//@version=6
strategy("EMA 50 and EMA 150 with SMA150 Stop-loss and Re-Entry #ganges", overlay=true, commission_type=strategy.commission.percent, commission_value=0.1, slippage=3)


// EMA and SMA Calculations
ema50 = ta.ema(close, 50)
ema150 = ta.ema(close, 150)
sma150 = ta.sma(close, 150)

// Conditions for Buy, Sell, and Stop-Loss
ema50CrossAboveEMA150 = ta.crossover(ema50, ema150)  // Buy signal
ema50CrossBelowEMA150 = ta.crossunder(ema50, ema150) // Sell signal
priceCrossAboveEMA150 = ta.crossover(close, ema150) // Price crosses EMA 150 from below
priceCloseBelowSMA150 = close < sma150              // Stop-loss for long positions


// Track stop-loss hit state
var bool stopLossHit = false

// Strategy Logic
// Buy Logic: EMA 50 crosses EMA 150 from below
if ema50CrossAboveEMA150
    strategy.entry("Buy Signal", strategy.long, qty=1)
    stopLossHit := false // Reset stop-loss state when a new buy position is opened

// Sell Logic: EMA 50 crosses EMA 150 from above
if ema50CrossBelowEMA150
    strategy.entry("Sell Signal", strategy.short, qty=1)
    stopLossHit := false // Reset stop-loss state when a new sell position is opened

// Stop-Loss for Long Positions: Close if price falls below SMA 150
if strategy.position_size > 0 and priceCloseBelowSMA150
    strategy.close("Buy Signal")
    stopLossHit := true // Mark stop-loss hit

// Re-Entry Logic After Stop-Loss
if stopLossHit
    if priceCrossAboveEMA150 // Re-buy logic: PRICE crosses EMA 150 from below
        strategy.entry("Re-Buy Signal", strategy.long, qty=1)
        stopLossHit := false // Reset stop-loss state after re-entry
    if ema50CrossBelowEMA150 // Re-sell logic: EMA 50 crosses EMA 150 from above
        strategy.entry("Re-Sell Signal", strategy.short, qty=1)
        stopLossHit := false // Reset stop-loss state after re-entry

// Plot EMA and SMA Lines
plot(ema50, color=color.blue, title="EMA 50")
plot(ema150, color=color.red, title="EMA 150")
plot(sma150, color=color.orange, title="SMA 150")


// // Calculate Recent All-Time High
// highestHigh = ta.highest(high, 500) // Lookback period of 500 bars
// percentageFall = ((highestHigh - close) / highestHigh) * 100

// // Display Percentage Fall on the Most Recent Candle Only
// isLastBar = bar_index == ta.max(bar_index)
// if isLastBar
//     labelText = str.tostring(percentageFall, "#.##") + "% Fall from ATH"
//     labelPosition = high + ta.atr(14) * 2 // Positioning label above the candle
//     label.new(bar_index, labelPosition, labelText, color=color.red, textcolor=color.white, size=size.small, style=label.style_label_down)