Estrategia de trading de tendencias inteligente con múltiples indicadores cruzados

Descripción general
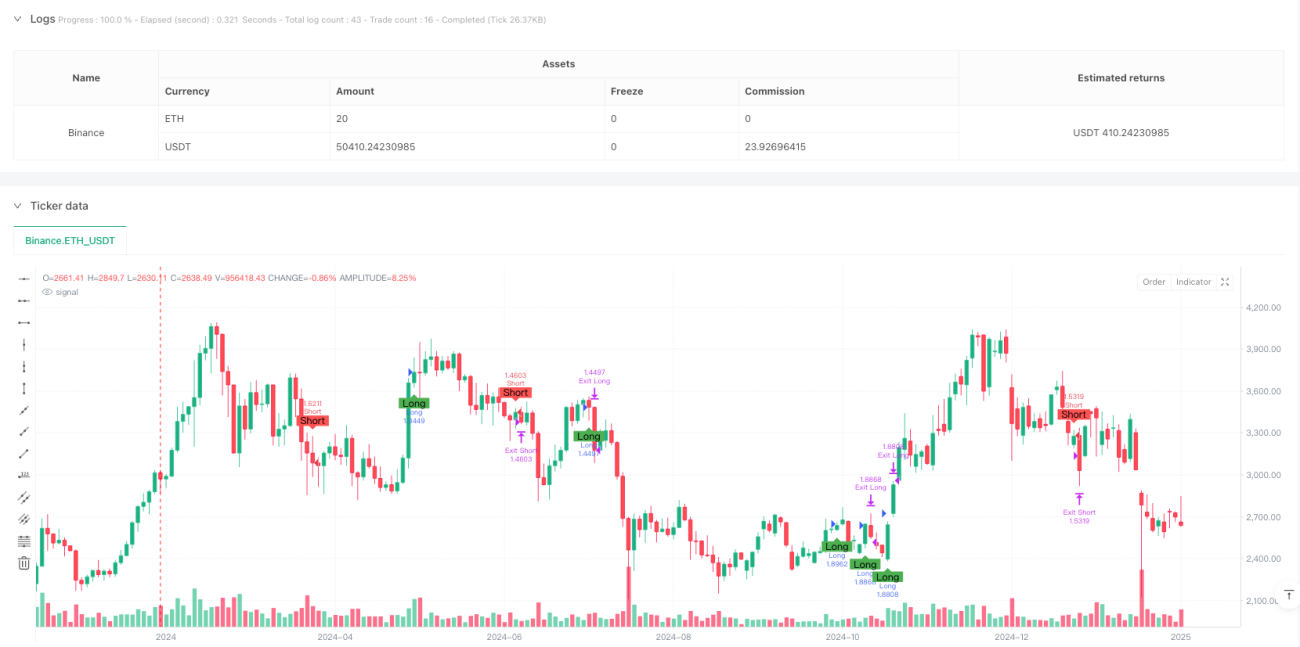
Se trata de una estrategia de seguimiento de tendencias inteligente basada en señales cruzadas de múltiples indicadores técnicos. La estrategia integra los tres indicadores técnicos principales, el promedio móvil (EMA), el indicador de fuerza relativa (RSI) y la dispersión de la tendencia de la media móvil (MACD), para identificar las tendencias del mercado a través de la confirmación de señales multidimensionales y para la gestión del riesgo junto con el stop loss dinámico.
Principio de estrategia
La lógica central de la estrategia se basa en un filtro de tres niveles de indicadores técnicos:
- Utiliza el cruce de las medias móviles de 9 y 21 períodos para confirmar la dirección de la tendencia
- El uso de un indicador relativamente débil (RSI) para filtrar las zonas de sobreventa y sobrecompra para evitar entrar en condiciones extremas de mercado
- Confirmación de la intensidad y dirección de la tendencia a través del indicador MACD
La generación de la señal de entrada debe cumplir simultáneamente con las siguientes condiciones:
- Hacer múltiples condiciones: EMA a corto plazo sobre EMA a largo plazo, RSI por debajo de 70, y la línea MACD por encima de la línea de señal
- Condiciones de vacío: EMA a corto plazo por debajo de EMA a largo plazo, RSI por encima de 30, y la línea MACD por debajo de la línea de señal
La estrategia adopta un modelo de posición porcentual de capital, con un interés de cuenta del 10% en cada transacción y un control de riesgo de un 2% de stop y un 1% de stop loss.
Ventajas estratégicas
- Verificación cruzada de múltiples indicadores para reducir significativamente el riesgo de señales falsas
- Ajuste automático del nivel de gestión de riesgos en función del precio de entrada
- Gestión de posiciones porcentual para la configuración óptima de la utilización de fondos
- Ejecución totalmente automatizada, sin necesidad de intervención humana y con menor impacto emocional
- Sistema de gestión de riesgos completo, incluyendo control de posición y mecanismo de suspensión de pérdidas
Riesgo estratégico
- Las múltiples señales pueden causar un retraso en la señal y perder oportunidades en el rápido movimiento.
- El Stop Loss de porcentaje fijo puede activarse prematuramente en mercados con mucha volatilidad
- La dependencia de los indicadores tecnológicos puede generar demasiadas señales falsas en el mercado horizontal
- Los costos de comisiones tienen un impacto significativo en los ingresos estratégicos
Sugerencias para el control de riesgos:
- Se ajusta dinámicamente el Stop Loss Stop Loss en función de las fluctuaciones del mercado
- Aumentar los filtros de intensidad de tendencia y reducir la frecuencia de las operaciones en el mercado horizontal
- Optimización de la gestión del tiempo de mantenimiento de las posiciones para evitar riesgos nocturnos
Dirección de optimización de la estrategia
- Optimización de parámetros indicadores
- Optimización de los ciclos EMA para encontrar la mejor combinación de ciclos corto y largo
- Ajuste de los umbrales de sobrecompra y sobreventa del RSI para adaptarse a las diferentes condiciones del mercado
- Optimización de los parámetros MACD para mejorar la precisión de la identificación de tendencias
- Optimización de la gestión de riesgos
- Implementación de un índice de stop loss dinámico que se ajusta automáticamente a la volatilidad del mercado
- Aumentar el mecanismo de control de la retirada máxima
- Introducción de un mecanismo de tiempo de salida para evitar la reclusión prolongada
- Optimización de la ejecución de transacciones
- Aumentar los filtros de volumen de transacciones para evitar el comercio en un entorno de baja liquidez
- Mecanismos para la construcción de almacenes por lotes y la mejora de la rentabilidad de los mismos
- Adición de indicadores de volatilidad del mercado y ajuste dinámico de la proporción de posiciones
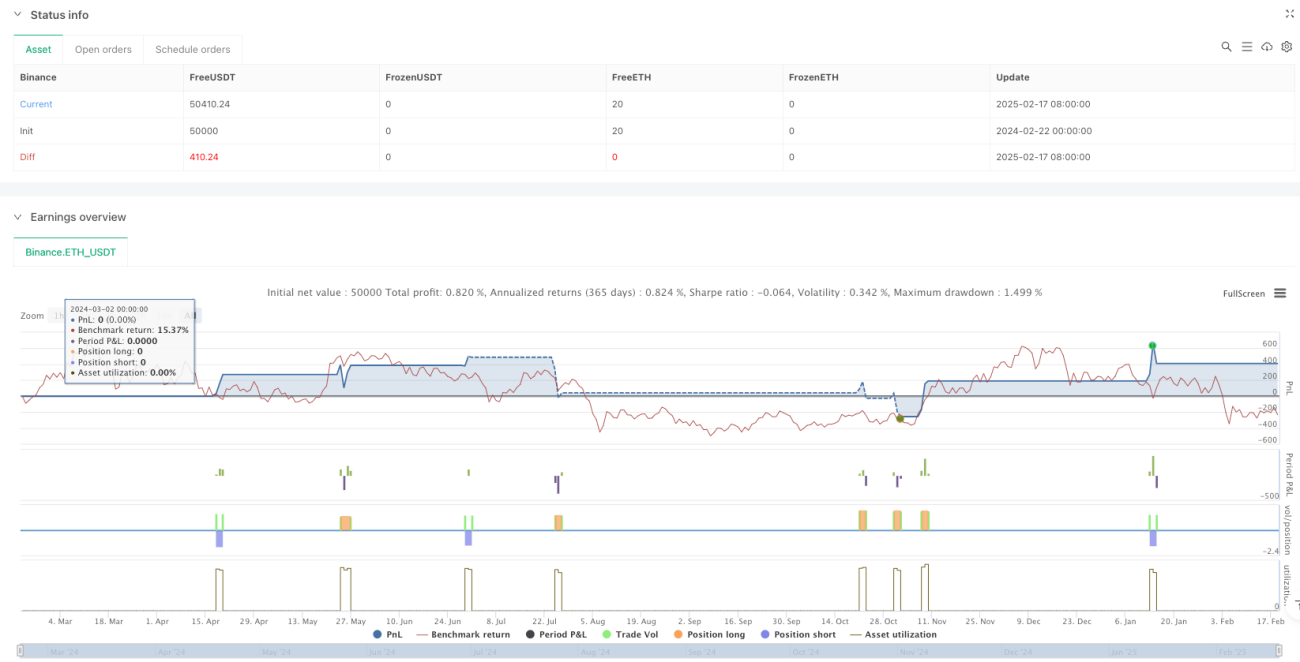
Resumir
La estrategia, a través de la sinergia de múltiples indicadores técnicos, construye un sistema de seguimiento de tendencias relativamente completo. Las ventajas de la estrategia residen en la alta fiabilidad de la señal y la gestión de riesgos, pero también existe un cierto retraso y dependencia del entorno del mercado. A través de la dirección de optimización de las recomendaciones, la estrategia puede mejorar aún más su adaptabilidad y estabilidad.
- 1