Estrategia de inversión de tendencia de doble impulso basada en el RSI y el RSI estocástico

Descripción general
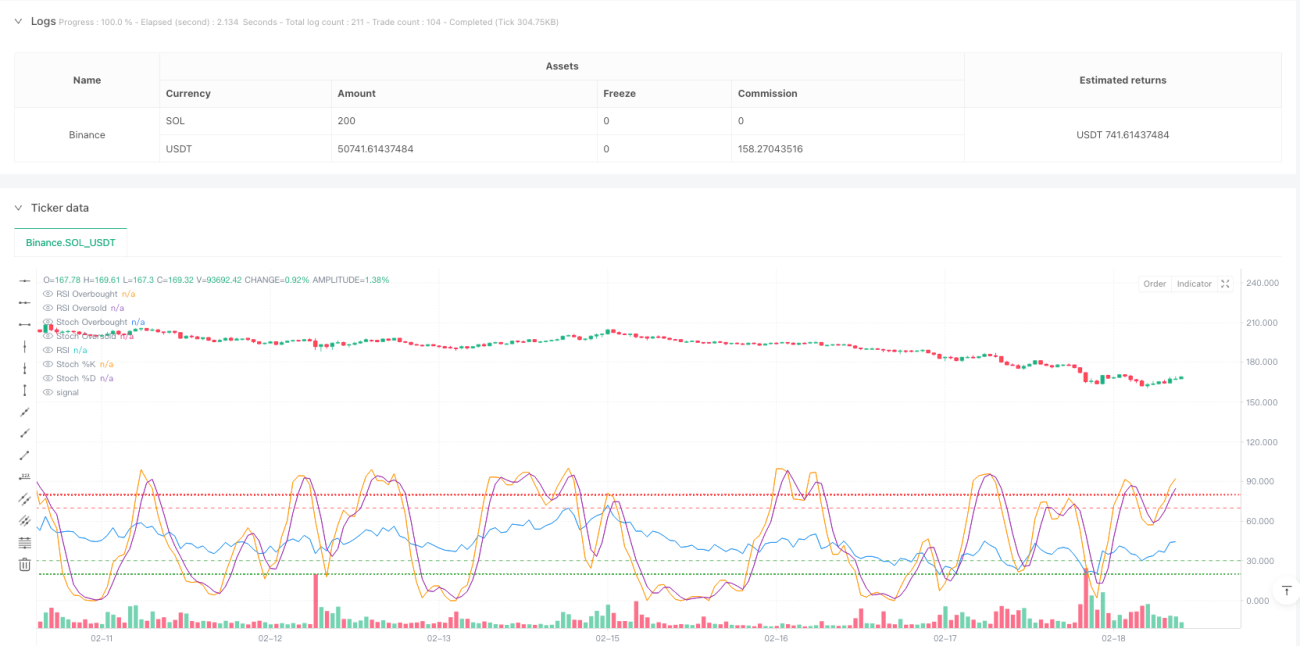
Esta es una estrategia de inversión de tendencia que combina un indicador relativamente débil (RSI) y un indicador relativamente débil aleatorio (RSI estocástico). La estrategia capta un potencial reverso mediante la identificación de un estado de sobreventa y sobreventa en el mercado, así como cambios en el dinamismo. El núcleo de la estrategia es tomar el RSI como un indicador de dinámica básica y luego calcular el RSI estocástico sobre esta base para confirmar aún más la dirección de los cambios en la dinámica de los precios.
Principio de estrategia
La lógica principal de la estrategia incluye los siguientes pasos clave:
- Primero se calcula el valor RSI del cierre para determinar el estado de sobrecompra y sobreventa en general
- Calcular el %K y el %D del RSI estocástico basado en el RSI
- Cuando el RSI está en la zona de sobreventa (default below 30) y la línea %K del RSI estocástico cruza la línea %D desde abajo hacia arriba, se activa una señal de multiplicación
- Cuando el RSI está en la zona de sobreventa (por defecto más de 70) y la línea %K del RSI estocástico cruza la línea %D desde arriba hacia abajo, se activa una señal de brecha
- Cuando se produce un cruce inverso de las condiciones RSI opuestas o Stochastic RSI, la salida de la posición en posición cerrada
Ventajas estratégicas
- Mecanismo de doble confirmación - El uso de RSI y RSI estocástico en combinación puede reducir el riesgo de falsas brechas
- Parámetros personalizables - los parámetros clave de la estrategia, como el ciclo RSI, el límite de sobreventa y sobreventa, pueden ajustarse según las diferentes condiciones del mercado
- Visualización dinámica - La estrategia ofrece una visualización gráfica en tiempo real del RSI y el RSI estocástico para facilitar la supervisión de los operadores
- Integración de la gestión de riesgos - incluye un mecanismo completo de cierre de pérdidas y cierre de ganancias
- Adaptabilidad - puede aplicarse a diferentes períodos de tiempo y entornos de mercado
Riesgo estratégico
- Riesgo de mercado en movimiento - falsas señales frecuentes que pueden producirse en mercados en movimiento horizontal
- Riesgo de retraso - La señal puede retrasarse un poco debido al uso de una suavizada de línea media múltiple
- Sensibilidad de parámetros - diferentes configuraciones de parámetros pueden dar lugar a resultados de transacciones significativamente diferentes
- Dependencia del entorno del mercado - puede perderse parte de las acciones en un mercado de tendencia fuerte
- Gestión del riesgo de los fondos: la necesidad de establecer razonablemente la proporción de posiciones para controlar el riesgo
Dirección de optimización de la estrategia
- Añadir un filtro de tendencia - se puede agregar una media móvil a largo plazo como un filtro de tendencia y abrir posiciones solo en la dirección de la tendencia
- Mecanismos de optimización de la parada - se puede introducir una parada dinámica, como la parada de seguimiento o la parada ATR
- Introducción de indicadores de tráfico - La combinación de análisis de tráfico puede mejorar la fiabilidad de la señal
- Añadir filtros de tiempo - para evitar las noticias importantes o los momentos de baja movilidad
- Desarrollar parámetros de adaptación - ajustar automáticamente los parámetros de la estrategia en función de la volatilidad del mercado
Resumir
Se trata de una estrategia integral que combina la dinámica y el cambio de tendencia para identificar oportunidades de comercio potenciales a través de la sinergia de RSI y RSI estocástico. La estrategia está diseñada de manera razonable, con una buena adaptabilidad y adaptabilidad.
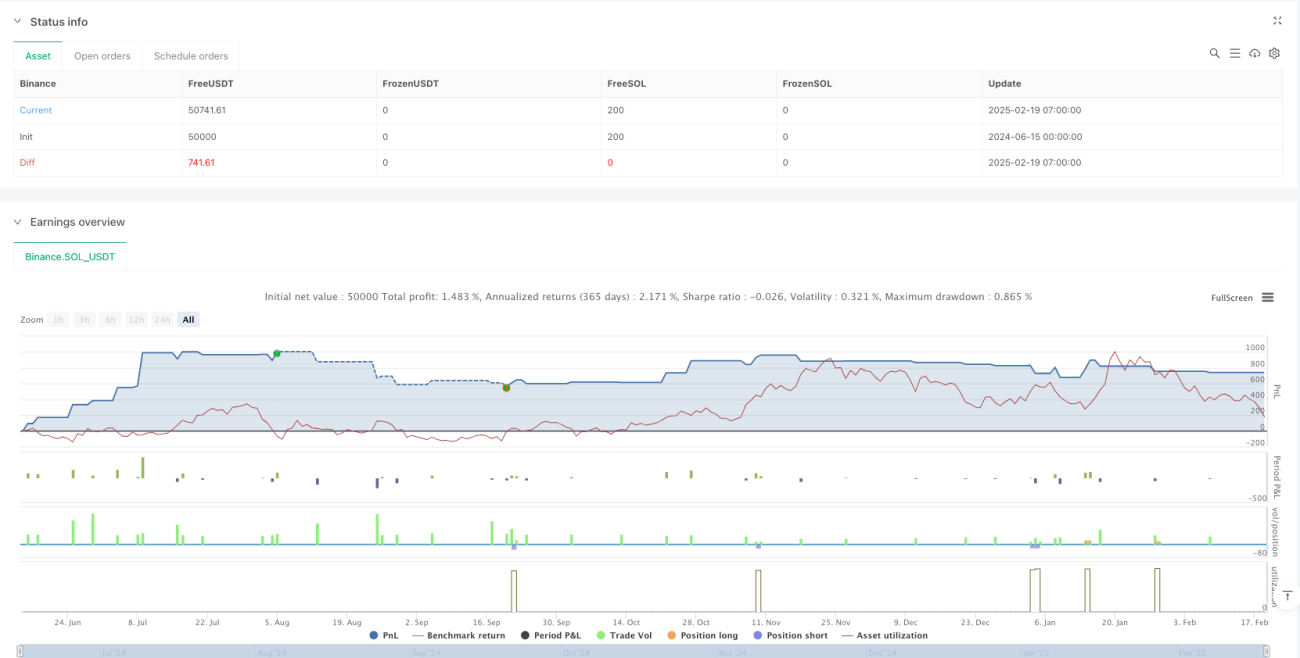
/*backtest
start: 2024-06-15 00:00:00
end: 2025-02-19 08:00:00
period: 1h
basePeriod: 1h
exchanges: [{"eid":"Binance","currency":"SOL_USDT"}]
*/

//@version=5
strategy("RSI + Stochastic RSI Strategy", overlay=true, initial_capital=100000, default_qty_type=strategy.percent_of_equity, default_qty_value=10)

// INPUTS- 1