Estrategia integrada de ruptura de tendencias con indicadores técnicos multidimensionales

Descripción general
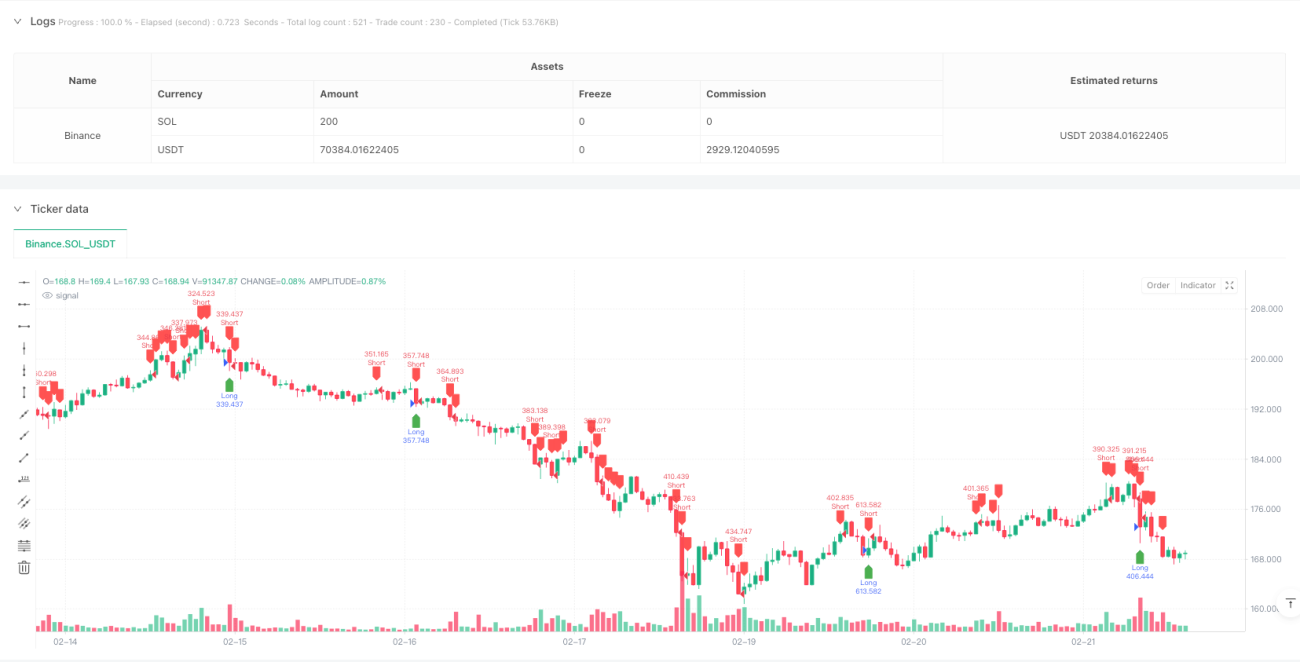
La estrategia es un sistema de comercio de ruptura de tendencias que combina varios indicadores técnicos y modelos gráficos. Captura los puntos de inflexión de la tendencia del mercado mediante la identificación de las formas gráficas clave (como dobles cimas / dobles cimas, cimas / cimas) y las rupturas de precios, al tiempo que combina indicadores técnicos como EMA, ATR y volumen de transacciones para filtrar señales y administrar el riesgo, lo que permite un seguimiento de tendencias y un control de riesgos eficientes.
Principio de estrategia
La lógica central de la estrategia consta de tres partes principales:
- Reconocimiento de patrones gráficos: utiliza el método de ventana deslizante para reconocer formas técnicas clásicas como dobles cimas / dobles cimas, forma de cabeza y hombros, y la señal de reversión de tendencia mediante la comparación de los puntos altos y bajos y la confirmación cruzada de EMA.
- Sistema de confirmación de tendencias: utiliza el EMA de 50 ciclos como filtro de tendencias, en combinación con la dirección de la tendencia de confirmación de ruptura de precios, para verificar la eficacia de la señal a través del filtro de volumen de transacciones (que requiere un volumen de transacciones superior al 120% del promedio de 20 días).
- Sistema de gestión de riesgos: basado en la configuración dinámica de 14 ciclos de ATR para detener el deterioro, el control preciso de la proporción de riesgo-beneficio a través de 1.5 veces el ATR.
Ventajas estratégicas
- Fusión de señales multidimensionales: combinación de información de mercado en varias dimensiones, como patrones gráficos, medias móviles, volatilidad y volumen de transacción, para mejorar la fiabilidad de la señal.
- Gestión de riesgo dinámica: utiliza ATR para ajustar dinámicamente la posición de sus paradas y pérdidas para adaptarse a diferentes entornos de mercado.
- Alta automatización: el sistema reconoce automáticamente las formas, emite señales de transacción y ejecuta órdenes, reduciendo la intervención humana.
- Indicaciones visuales claras: muestra las señales de negociación de forma intuitiva a través de marcas gráficas y sistemas de alerta.
Riesgo estratégico
- Riesgo de brechas falsas: Las señales de brechas falsas pueden aparecer en mercados convulsionados y deben ser confirmadas por un volumen de transacciones estricto.
- Riesgo de atraso: Indicadores como la media móvil y el ATR tienen un cierto atraso y pueden perder el mejor momento de entrada.
- Sensibilidad de parámetros: la eficacia de la estrategia es más afectada por la configuración de parámetros, y se necesita determinar los parámetros óptimos mediante la optimización de retroalimentación.
- Dependencia del entorno del mercado: en mercados horizontales sin tendencia, la estrategia puede no funcionar de manera óptima.
Dirección de optimización de la estrategia
- Introducción de la identificación del entorno del mercado: añadir indicadores de intensidad de la tendencia (como el ADX) para distinguir entre mercados en tendencia y mercados convulsivos, y parámetros de estrategia de ajuste dinámico.
- Filtración de señales de optimización: Se puede considerar la adición de indicadores de oscilación como el RSI para filtrar aún más las falsas señales de ruptura.
- Mejorar el control de riesgos: introducir un sistema de gestión de posiciones, ajustando el tamaño de las posiciones según la dinámica de la volatilidad del mercado.
- Mejorar la adaptabilidad: Desarrollar un sistema de parámetros de adaptación que optimice automáticamente los parámetros de la estrategia en función de las condiciones del mercado.
Resumir
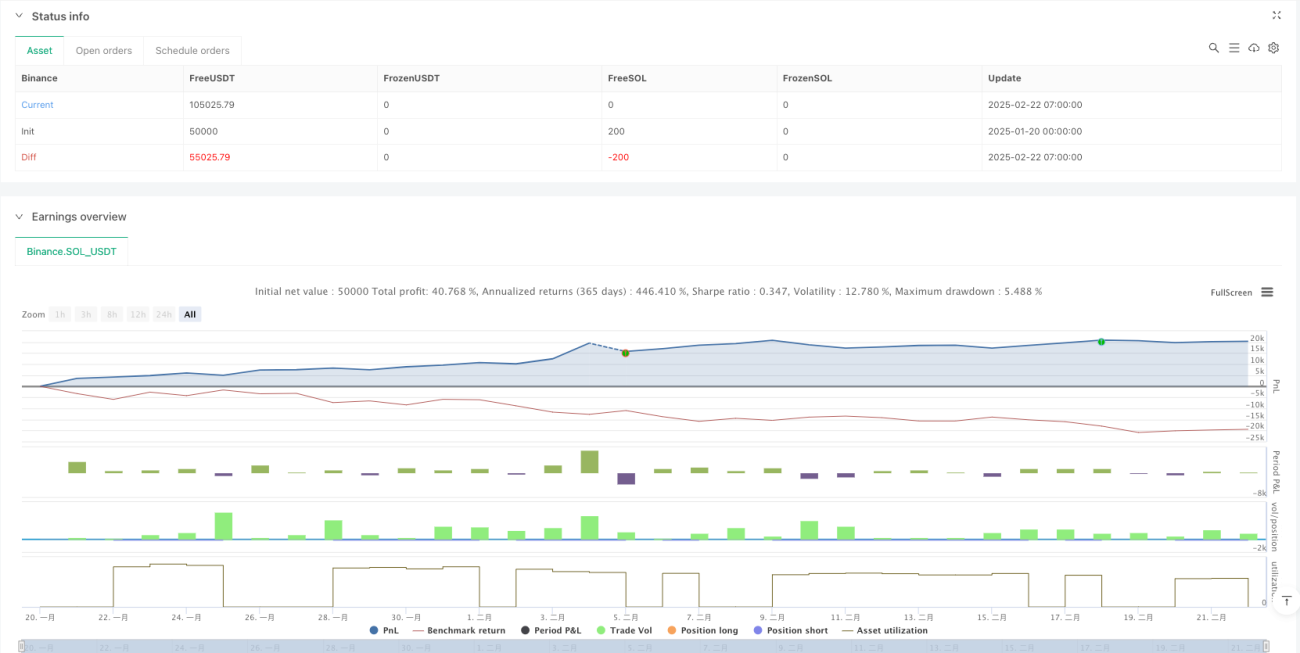
La estrategia permite la captura efectiva de los puntos de inflexión de las tendencias del mercado a través de la aplicación integrada de indicadores técnicos multidimensionales. El diseño del sistema tiene en cuenta todos los elementos clave, como la generación de señales, la confirmación de tendencias y el control de riesgos, y tiene una gran utilidad.
/*backtest
start: 2025-01-20 00:00:00
end: 2025-02-22 08:00:00
period: 1h
basePeriod: 1h
exchanges: [{"eid":"Binance","currency":"SOL_USDT"}]
*/

//@version=5
strategy("Ultimate Pattern Finder", overlay=true, default_qty_type=strategy.percent_of_equity, default_qty_value=100)

// 🎯 CONFIGURABLE PARAMETERS- 1