
Descripción general
Esta estrategia es una metodología de trading cuantitativa que utiliza una combinación de indicadores técnicos para lograr una captura precisa de las tendencias del mercado y operaciones controladas por el riesgo mediante la combinación de indicadores como el promedio móvil de índice (EMA), el índice de fuerza relativa (RSI), el rango de fluctuación real promedio (ATR), el precio promedio ponderado por volumen de transacción (VWAP) y la supertendencia (Supertrend).
Principio de estrategia
El principio central de la estrategia está basado en la interacción de indicadores técnicos multidimensionales:
- Utiliza las medias móviles de 50 y 200 días (EMA) para determinar la dirección de la tendencia y los posibles puntos de reversión de la tendencia
- Confirme la dinámica de la tendencia y evite el exceso de alza o bajada a través de un índice relativamente fuerte (RSI)
- Calculación de la pérdida dinámica y la distancia de parada utilizando el rango de fluctuación real promedio (ATR)
- Combinación de soportes y presiones para comprobar el movimiento de los precios en el precio medio ponderado por volumen de transacción (VWAP)
- Indicador de Supertrend para confirmar la dirección de la tendencia y las señales de negociación
Ventajas estratégicas
- Sincronización de múltiples indicadores: mejora significativamente la precisión y la fiabilidad de la señal mediante la integración de varios indicadores técnicos
- Gestión de riesgos: Dinámico ATR de pérdidas y tasas de retorno de riesgo fijas, control eficaz de los riesgos de una sola operación
- Flexible: puede ajustar los parámetros de acuerdo con los cambios en el mercado y adaptarse a las diferentes circunstancias del mercado
- Filtración de señales: filtra las señales de incertidumbre a través de indicadores como el RSI y el VWAP para reducir las transacciones erróneas
- En tiempo real: genera señales y alertas de comercio en tiempo real para que los comerciantes puedan responder rápidamente a los cambios en el mercado
Riesgo estratégico
- Sensibilidad de los parámetros: la configuración incorrecta de los parámetros del indicador puede causar señales de negociación frecuentes o ausentes
- Los acontecimientos inesperados en el mercado: No hay forma de evitar el evento de los cisnes negros y las fuertes fluctuaciones en el mercado
- Riesgo de sobreajuste: Se requiere un buen retroceso y verificación de los parámetros de la estrategia
- Costos de transacción: las transacciones frecuentes pueden aumentar los honorarios y los costos de los puntos de deslizamiento.
- Falta de eficacia de los indicadores: en ciertas fases del mercado, algunos indicadores técnicos pueden perder su eficacia predictiva
Dirección de optimización de la estrategia
- Introducción de algoritmos de aprendizaje automático: ajuste dinámico de los parámetros del indicador con tecnología de IA
- Aumentar las condiciones de filtración: introducir indicadores adicionales como la volatilidad y el volumen de transacciones
- Desarrollo de un módulo de análisis de múltiples períodos: validación de señales de negociación en diferentes escalas de tiempo
- Optimización de la gestión de riesgos: introducción de estrategias más complejas de gestión de posiciones y gestión de fondos
- Aumentar los parámetros de adaptación: ajustar automáticamente las estrategias de stop loss y stop loss según la volatilidad del mercado
Resumir
Se trata de una estrategia de trading cuantitativa basada en indicadores tecnológicos multidimensionales, cuyo objetivo es capturar las tendencias del mercado y controlar el riesgo de negociación a través de una combinación sistemática de indicadores y una estricta gestión del riesgo. El núcleo de la estrategia radica en la sinergia de los indicadores y la optimización de los parámetros dinámicos, lo que ofrece una forma flexible y relativamente sólida de operar con un trading cuantitativo.
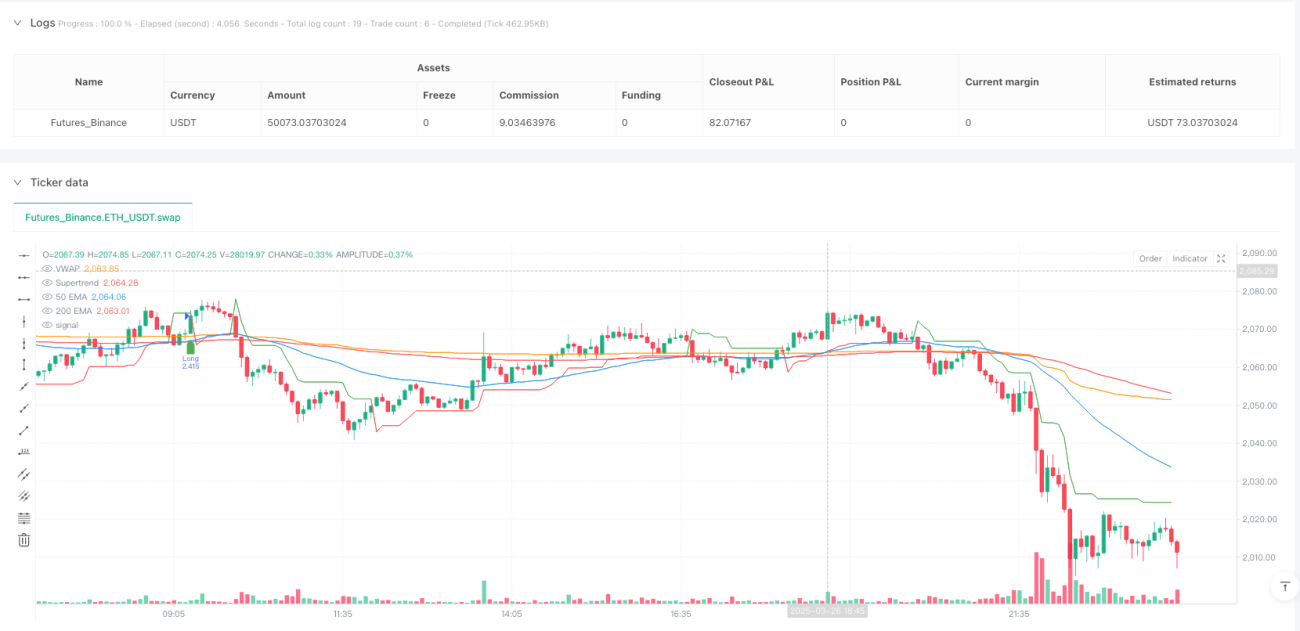
/*backtest
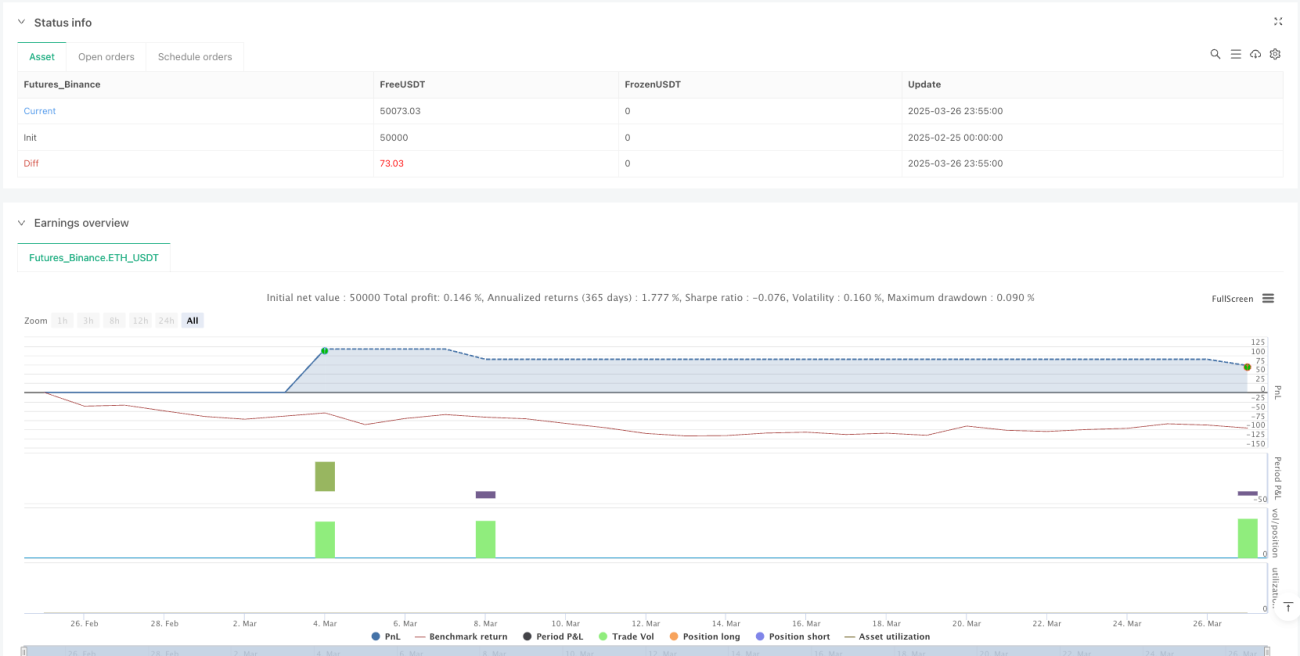
start: 2025-02-25 00:00:00
end: 2025-03-27 00:00:00
period: 5m
basePeriod: 5m
exchanges: [{"eid":"Futures_Binance","currency":"ETH_USDT"}]
*/
//@version=6
strategy("Advanced BTC/USDT Strategy", overlay=true, default_qty_type=strategy.percent_of_equity, default_qty_value=10)
// ==== INPUT PARAMETERS ====- 1