
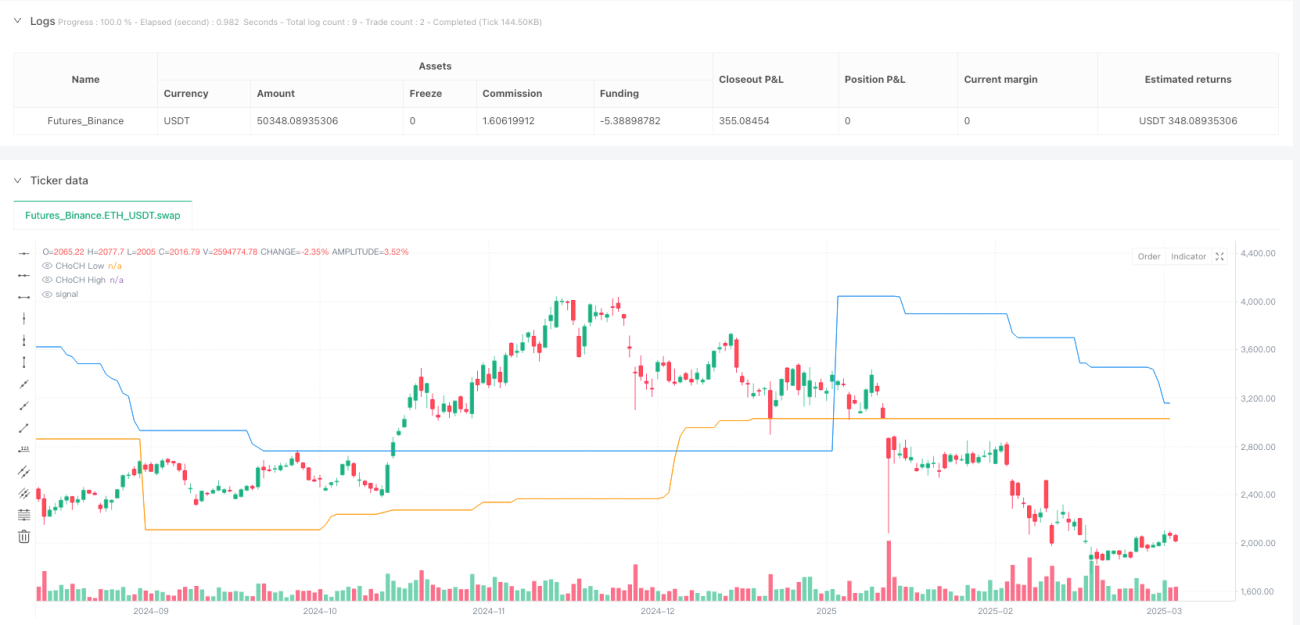
Descripción general
La estrategia de comercio de fluctuación de la estructura del mercado es un método de comercio avanzado basado en cambios en la estructura del mercado, captura de liquidez y movimiento de tendencias. La estrategia proporciona a los comerciantes un marco de decisión de comercio sistematizado mediante el análisis de las características clave de los cambios en los precios, la identificación de posibles inversiones de tendencia y oportunidades de continuación.
Principio de estrategia
La estrategia se basa en cuatro indicadores clave:
- CHOCH (Change of Character): Identificación de los puntos de inflexión en la tendencia de los precios para determinar la dirección potencial del mercado.
- La ruptura de la estructura (BOS): confirma la dinámica de la tendencia y la ruptura de la dirección.
- Inducements, IDM: captura de las trampas de liquidez y movimientos de capital en los mercados.
- Sweeps: identificación de brechas falsas y aprovechamiento de oportunidades de liquidez
La estrategia utiliza un conjunto de indicadores de análisis técnico, incluidos el rango de fluctuación real promedio (ATR), el índice de fuerza relativa (RSI) y el volumen de transacciones, para construir un sistema de decisión de transacciones multidimensional.
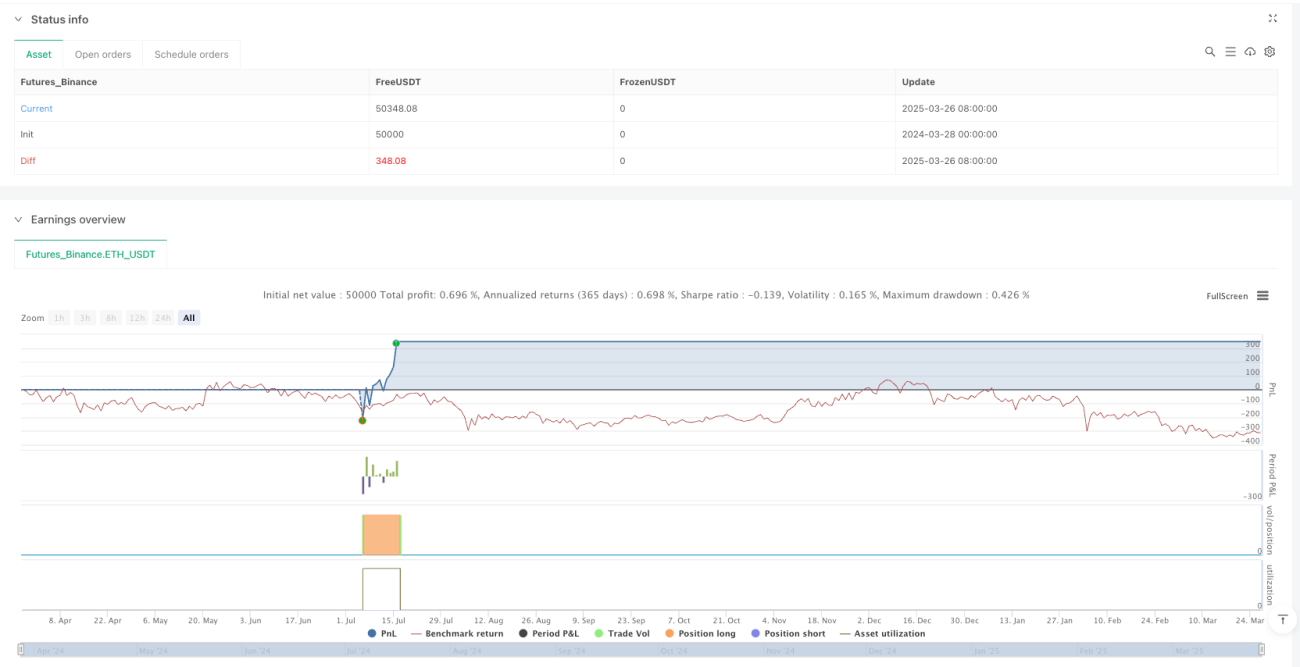
Ventajas estratégicas
- Gestión de riesgos sistemática: Control eficaz del riesgo de una sola transacción mediante el cálculo de stop loss y stop loss mediante ATR.
- Condiciones de filtración múltiples: combinación de CHoCH, BOS, RSI y volumen de intercambio para mejorar la precisión de la señal.
- Gestión de posiciones dinámica: utiliza el porcentaje de derechos y intereses para configurar las posiciones de negociación y optimizar la eficiencia en el uso de los fondos.
- Flexibles mecanismos de entrada y salida: las estrategias de negociación se pueden ajustar a la dinámica de la estructura del mercado.
Riesgo estratégico
- Riesgo de una falsa ruptura: los indicadores de la estructura del mercado pueden generar señales engañosas.
- Sensibilidad de parámetros: los ajustes de los parámetros de la estrategia tienen un impacto significativo en el rendimiento.
- El volumen de transacciones y el riesgo de liquidez: puede tener un mal desempeño en un mercado con poca liquidez.
- Controles de retracción: En un mercado de tendencia continua, es posible que se enfrente a una mayor retirada.
Dirección de optimización de la estrategia
- Introducción de algoritmos de aprendizaje automático: optimización de la selección de parámetros y reconocimiento de señales.
- Aumentar el análisis de múltiples marcos de tiempo: mejorar la fiabilidad de la señal.
- Desarrollar módulos de gestión de riesgos dinámicos: ajustar posiciones de acuerdo con la volatilidad del mercado.
- Integración de más indicadores técnicos, como MACD, banda de Brin, y otros, para mejorar la filtración de señales.
Resumir
Las estrategias de trading de fluctuación de la estructura del mercado son un método de trading cuantitativo avanzado que proporciona a los operadores un marco de decisión de trading robusto a través de un análisis sistematizado de la estructura del mercado. A través de la optimización continua y la gestión del riesgo, la estrategia tiene el potencial de obtener un rendimiento de trading estable en diferentes entornos de mercado.
/*backtest
start: 2024-03-28 00:00:00
end: 2025-03-27 00:00:00
period: 1d
basePeriod: 1d
exchanges: [{"eid":"Futures_Binance","currency":"ETH_USDT"}]
*/

//@version=5
strategy("Market Structure Swing Trading", overlay=true, default_qty_type=strategy.percent_of_equity, default_qty_value=5)

// === Input Parameters ===- 1