Estrategia de trading cuantitativa de seguimiento de tendencia con múltiples indicadores de impulso

Resumen
La estrategia de trading cuantitativo de seguimiento de tendencias con múltiples indicadores de momento es un método de trading cuantitativo compuesto que combina la media móvil exponencial (EMA), el índice de fuerza relativa (RSI) y el indicador de convergencia y divergencia de medias móviles (MACD). Al integrar múltiples indicadores técnicos, esta estrategia busca mejorar la precisión y fiabilidad de las señales de trading, siendo especialmente adecuada para operaciones a corto y mediano plazo en mercados de alta volatilidad.
Principio de la estrategia
El principio central de esta estrategia es la validación conjunta de múltiples indicadores:
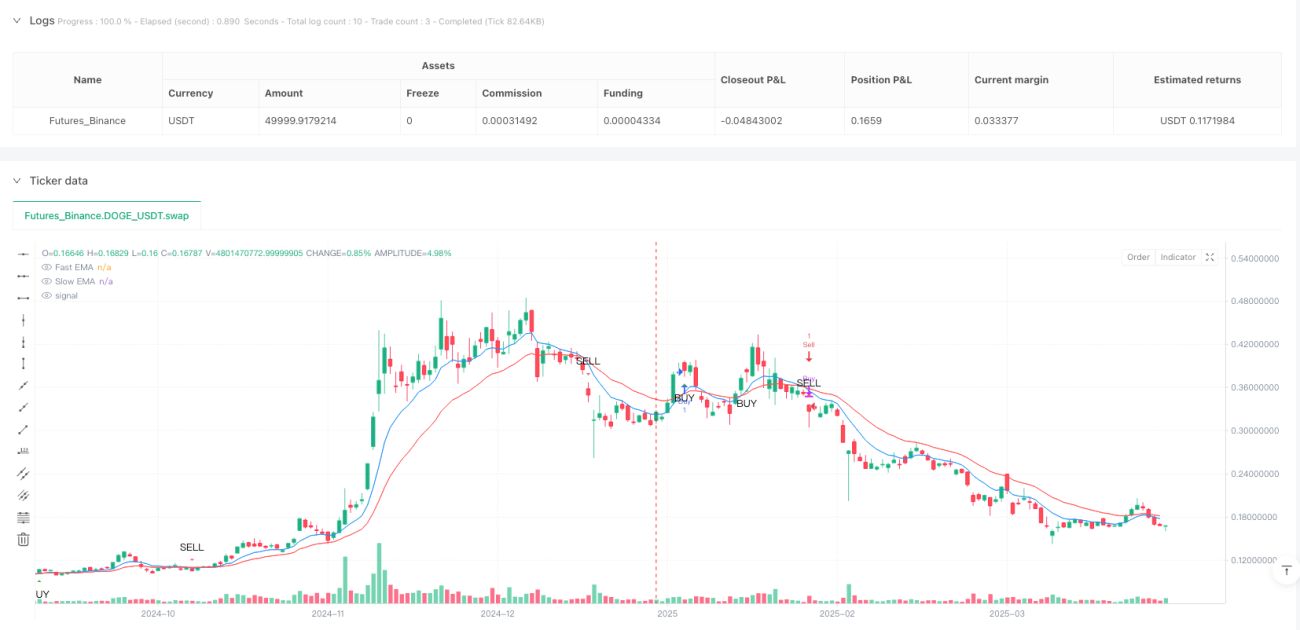
- Utiliza EMA rápida (periodo 9) y EMA lenta (periodo 21) para determinar la dirección de la tendencia y los cambios de momento.
- Emplea el RSI (periodo 14) para confirmar el momento del mercado y las condiciones de sobrecompra/sobreventa.
- Aplica el indicador MACD para verificar el momento y la dirección de la tendencia.
Reglas específicas de generación de señales de trading:
- Cuando la EMA rápida cruza por encima de la EMA lenta, y el RSI > 50, y la línea MACD está por encima de la línea de señal, se genera una señal de compra.
- Cuando la EMA rápida cruza por debajo de la EMA lenta, y el RSI < 50, y la línea MACD está por debajo de la línea de señal, se genera una señal de venta.
Ventajas de la estrategia
- Validación conjunta de múltiples indicadores, reduciendo significativamente el riesgo de señales falsas.
- Captura dinámica de cambios en la tendencia del mercado, con alta adaptabilidad.
- Parámetros ajustables, flexibilidad para responder a diferentes entornos de mercado.
- Lógica de generación de señales clara, fácil de entender e implementar.
- Adecuada para operaciones a corto y mediano plazo en mercados de alta volatilidad.
Riesgos de la estrategia
- En mercados laterales puede generar operaciones ineficaces frecuentes.
- Una selección inadecuada de parámetros de los indicadores puede reducir la eficiencia del trading.
- No considera el impacto de los costos de transacción y el deslizamiento.
- La estabilidad de la estrategia es limitada en entornos de mercado únicos.
Direcciones de optimización de la estrategia
- Introducir condiciones de filtrado adicionales, como la confirmación del volumen.
- Agregar mecanismos de stop-loss y take-profit.
- Ajustar dinámicamente los parámetros de EMA, RSI y MACD.
- Desarrollar algoritmos de adaptación de parámetros basados en aprendizaje automático.
- Incorporar más indicadores de juicio del entorno del mercado.
Resumen
La estrategia de trading cuantitativo de seguimiento de tendencias con múltiples indicadores de momento construye un sistema de generación de señales de trading relativamente robusto mediante la integración de tres indicadores técnicos clave: EMA, RSI y MACD. Esta estrategia mantiene suficiente flexibilidad y posee una capacidad de control de riesgos sólida, ofreciendo a los traders cuantitativos un esquema de trading digno de un estudio más profundo.
- 1