
Resumen
La estrategia de Momentum Adaptativo de Tendencia basada en la Teoría de Dow es un método de trading avanzado fundamentado en los principios clásicos de la Teoría de Dow, que guía las decisiones de trading identificando puntos de inflexión clave en las tendencias del mercado. La estrategia se centra en detectar y confirmar la dinámica fundamental de las tendencias de precios, utilizando máximos crecientes (Higher Highs) y mínimos crecientes (Higher Lows) para definir una tendencia alcista, y máximos decrecientes (Lower Highs) y mínimos decrecientes (Lower Lows) para definir una tendencia bajista. Este enfoque busca proporcionar un método sistemático para capturar las tendencias del mercado y reaccionar rápidamente ante cambios en la tendencia.
Principios de la Estrategia
El principio central de esta estrategia se basa en el método clásico de identificación de tendencias de la Teoría de Dow. La estrategia detecta puntos de inflexión clave utilizando las funciones ta.pivothigh() y ta.pivotlow(). La implementación específica incluye los siguientes pasos clave:
- Detección de puntos de inflexión: Se utiliza el parámetro
pivotLookbackpara determinar el número de barras a ambos lados, con el fin de identificar máximos y mínimos. - Confirmación de tendencia: La tendencia alcista solo se confirma cuando se cumplen simultáneamente las condiciones de máximos crecientes y mínimos crecientes; de manera similar, la tendencia bajista solo se confirma cuando se cumplen las condiciones de máximos decrecientes y mínimos decrecientes.
- Persistencia de la tendencia: Si no se cumplen las condiciones de cambio de tendencia, la estrategia mantiene el estado de tendencia anterior, logrando un seguimiento de tendencia más suave.
Ventajas de la Estrategia
- Identificación dinámica de tendencias: Al analizar continuamente los puntos de inflexión clave, la estrategia puede capturar dinámicamente los cambios de tendencia del mercado.
- Modos de trading flexibles: Ofrece tres modos de trading (automático, solo largo y solo corto) para satisfacer las necesidades de diferentes traders.
- Gestión de riesgos: Mecanismos integrados de stop-loss y take-profit que permiten controlar eficazmente el riesgo de cada operación individual.
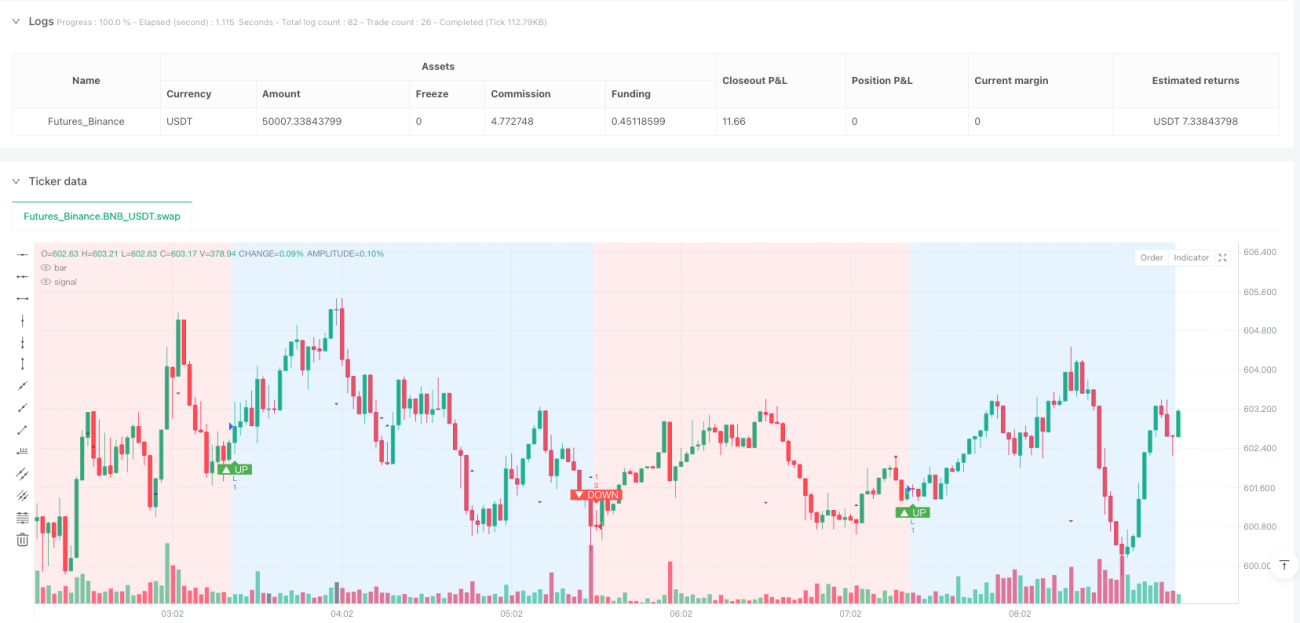
- Visualización de la tendencia: Muestra de forma intuitiva la dirección de la tendencia mediante colores de fondo y marcadores, facilitando a los traders la comprensión del estado del mercado.
- Baja latencia: En comparación con las estrategias tradicionales de medias móviles, este método puede responder más rápidamente a los cambios de tendencia.
Riesgos de la Estrategia
- Riesgo de rezago: Debido al uso de la detección de puntos de inflexión, la estrategia tiene un riesgo inherente de rezago y es posible que no capture las señales más tempranas de la tendencia.
- Riesgo en mercados laterales: En mercados sin fluctuaciones claras, los cambios de precio pequeños y frecuentes pueden generar operaciones innecesarias.
- Sensibilidad a los parámetros: La elección del parámetro
pivotLookbacktiene un impacto significativo en el rendimiento de la estrategia y requiere ajustes para diferentes mercados y marcos temporales. - Costes de trading: El trading frecuente puede generar altos costes de transacción, especialmente en entornos con comisiones elevadas.
Direcciones de Optimización de la Estrategia
- Incorporar filtros adicionales: Combinar indicadores de fuerza de tendencia (como ATR) para filtrar señales de tendencia débiles.
- Ajuste dinámico de parámetros: Desarrollar un mecanismo adaptativo para el parámetro
pivotLookbackbasado en la volatilidad del mercado. - Validación en múltiples marcos temporales: Validar las señales de tendencia en diferentes marcos temporales para aumentar su fiabilidad.
- Mejora con machine learning: Explorar el uso de algoritmos de aprendizaje automático para optimizar la identificación de tendencias y el momento de entrada.
- Optimización de la gestión de riesgos: Ajustar dinámicamente las distancias de stop-loss y take-profit según la volatilidad del mercado.
Resumen
La estrategia de Momentum Adaptativo de Tendencia basada en la Teoría de Dow es un potente método de seguimiento de tendencias que, mediante un innovador análisis de puntos de inflexión, proporciona a los traders una herramienta sistemática para la identificación de tendencias. Aunque presenta algunos riesgos inherentes, su flexibilidad y dinamismo la convierten en un enfoque valioso dentro de las estrategias modernas de trading cuantitativo. La aplicación exitosa de esta estrategia requiere una comprensión profunda de su funcionamiento y una optimización y ajuste continuos según el entorno específico del mercado.
- Introducir filtros adicionales: Combinar indicadores de fuerza de tendencia (como el ATR) para filtrar señales de tendencia débiles.
- Ajuste dinámico de parámetros: Desarrollar un mecanismo de parámetro pivotLookback adaptativo basado en la volatilidad del mercado.
- Verificación en múltiples marcos temporales: Verificar de forma cruzada las señales de tendencia en diferentes marcos temporales para mejorar la fiabilidad de las señales.
- Mejora mediante aprendizaje automático: Explorar el uso de algoritmos de aprendizaje automático para optimizar la identificación de tendencias y el momento de entrada.
- Optimización de la gestión de riesgos: Ajustar dinámicamente las distancias de stop-loss y take-profit en función de la volatilidad del mercado.
Conclusión
La Estrategia de Momento Adaptativo de la Tendencia de la Teoría de Dow es un potente método de seguimiento de tendencia que proporciona a los traders una herramienta sistemática de identificación de tendencias a través de técnicas innovadoras de análisis de puntos de inflexión. A pesar de algunos riesgos inherentes, su flexibilidad y dinamismo la convierten en un enfoque valioso en las estrategias modernas de trading cuantitativo. Aplicar con éxito esta estrategia requiere una comprensión profunda de sus principios de funcionamiento y una optimización y ajuste continuos basados en entornos de mercado específicos.
/*backtest
start: 2025-03-29 00:00:00
end: 2025-03-30 09:00:00
period: 2m
basePeriod: 2m
exchanges: [{"eid":"Futures_Binance","currency":"BNB_USDT"}]
*/

//@version=5
// strategy(title="Dow Theory Trend Strategy v3", shorttitle="Dow Trend Strat v3", overlay=true,
//      initial_capital=10000, default_qty_type=strategy.percent_of_equity, default_qty_value=10,
// commission_type=strategy.commission.percent, commission_value=0.1, // Example strategy settings with commission- 1