
Esta estrategia utiliza el movimiento de la media de los dos índices (EMA) para identificar oportunidades de reversión con una alta probabilidad. No se trata de una simple estrategia de cruce de la media, sino de buscar un momento en el que el precio rebote de la banda EMA y forme una fuerte dinámica. La estrategia utiliza EMAs de 12 y 21 ciclos para construir zonas de negociación y combina el patrón de la barra, la consistencia de la tendencia y un sistema de gestión de riesgos preciso para capturar la dinámica del mercado.
El principio central de esta estrategia es buscar señales de entrada mediante la identificación de situaciones en las que los precios reboten de las EMAs. Utiliza EMAs de 12 y 21 ciclos para crear bandas de negociación arriba y abajo y determina la dirección de la tendencia del mercado en función de la posición relativa de las EMAs.
Cuando EMA12 > EMA21 el mercado está en el ambiente de la baja (la zona verde), buscamos muchas oportunidades. Las condiciones para hacer muchas cosas incluyen: el precio de la línea de sombra inferior toca la banda de EMA, la formación de una fuerte tendencia de la baja (la entidad es mayor que la línea de sombra inferior), la minimización de la línea de sombra superior (menos del 2 por ciento del rango de la barra), el cierre de precios por encima de los dos EMA, la primera barra no se encuentra por debajo de la banda inferior, y la consistencia de la tendencia de la baja en varias raíces consecutivas.
Cuando EMA12 < EMA21, el mercado se encuentra en un entorno bajista (la zona roja), buscamos oportunidades de desvalorización. Las condiciones de desvalorización incluyen: la línea de la sombra superior del precio toca la zona EMA, la formación de una fuerte línea bajista (la entidad es mayor que la línea de la sombra superior), la minimizada línea de la sombra inferior (menos del 2% del rango de la barra), el precio de cierre por debajo de los dos EMA, la primera barra no se ha cerrado por encima de la banda superior, y la consistencia de la tendencia bajista en varias raíces consecutivas.
La estrategia tiene un sistema de gestión de riesgos con una relación de riesgo-rentabilidad fija, con un parámetro predeterminado de 3: 1, el parón se establece en el punto más alto/más bajo de la columna anterior, y el parón se calcula automáticamente según la relación de riesgo-rentabilidad.
La estrategia tiene varias ventajas significativas:
Potencial de alta ganancia: La estrategia puede identificar oportunidades de negociación con una alta probabilidad de éxito, al capturar el movimiento de la dinámica fuerte después de la rebote de la banda EMA.
Reglas claras de entrada y salida: La estrategia ofrece condiciones claras de negociación, reduciendo el impacto de los juicios subjetivos y las decisiones emocionales.
Gestión de riesgos: con un RRR fijo y un Stop Loss automático, se asegura que el riesgo de cada transacción está bajo control.
La estrategia consiste en operar sólo en la dirección dominante de la tendencia, evitando el alto riesgo de operar en contra.
Aplicable en varios períodos de tiempo: La estrategia funciona de manera efectiva en varios períodos de tiempo, ofreciendo opciones de negociación flexibles.
Sistema de alerta integral: Se incluye una función de alerta de señales de transacción detalladas para garantizar que no se pierda la oportunidad de negociar.
Ayuda visual: muestra la señal de negociación y el estado de las condiciones de forma intuitiva a través del cambio de color de fondo y las indicaciones de etiquetas.
A pesar de la buena concepción de la estrategia, existen los siguientes riesgos potenciales:
Riesgo de mercado en crisis: en mercados en discontinuidad o en crisis, las bandas EMA pueden volverse estrechas, generando señales frecuentes pero de baja calidad, lo que provoca pérdidas continuas.
Riesgo de un salto brusco: el mercado puede saltar después de noticias o eventos importantes, lo que invalida los puntos de parada y causa pérdidas superiores a las esperadas.
Optimización excesiva de los parámetros: la optimización excesiva de los parámetros de la estrategia puede causar ajuste de la curva, lo que hace que la estrategia no funcione bien en las operaciones en vivo.
Retraso en la identificación de tendencias: los EMA, como indicadores de retraso, pueden reaccionar más lentamente en los puntos de cambio de tendencia, lo que lleva a perder los mejores puntos de entrada o retrasar la salida.
Riesgo de desencadenamiento de stop loss: el ruido del mercado puede provocar que el precio vuelva a la dirección esperada después de que se haya activado el stop loss, lo que genera pérdidas innecesarias.
Las soluciones incluyen: suspender el comercio en mercados convulsos; usar filtros de fluctuación para evitar señales de baja calidad; confirmar tendencias en combinación con otros indicadores; medir y optimizar los parámetros periódicamente; considerar el uso de tracking stop loss.
La estrategia se puede optimizar en las siguientes direcciones:
Gestión de riesgos dinámica: ajusta automáticamente el rendimiento de riesgo y el tamaño de la posición en función de la volatilidad del mercado, reduciendo la apertura de riesgo en un entorno de alta volatilidad.
Introducción de filtros de alto nivel: en combinación con el indicador ATR para filtrar las señales de baja oscilación; adición de confirmación de transacciones para verificar la efectividad de la reversión del precio.
Análisis de múltiples períodos de tiempo: integra la dirección de la tendencia de períodos de tiempo más altos como condición de filtro adicional, que solo se incluye cuando las tendencias de varios períodos de tiempo coinciden.
Optimización de aprendizaje automático: ajuste dinámico de parámetros utilizando algoritmos de aprendizaje automático para adaptarse a la combinación óptima de parámetros según los diferentes entornos de mercado.
Realización de tracking stop: Implementación de un mecanismo de tracking stop después de que las ganancias alcancen un determinado nivel, bloqueando parte de las ganancias y permitiendo que la tendencia continúe.
Estrategias de ganancias parciales: Implementar estrategias de ganancias por lotes, reducir gradualmente la posición en diferentes precios objetivo, optimizar el rendimiento de la rentabilidad del riesgo en general.
Estas direcciones de optimización pueden mejorar la solidez, la adaptabilidad y la rentabilidad a largo plazo de las estrategias.
La estrategia binaria de comercio de la banda de movimiento de la media es un sistema de comercio integral que combina análisis técnico, identificación de patrones gráficos y una estricta gestión de riesgos. Captura oportunidades de mercado con una dinámica explosiva mediante la identificación de puntos de inflexión de alta probabilidad de que los precios reboten de la banda EMA. La ventaja central de la estrategia reside en sus claras reglas de negociación, su marco de rendimiento de riesgo fijo y sus requisitos de consistencia de tendencias, lo que la hace adecuada para todo tipo de entornos de mercado y períodos de tiempo.
A pesar de algunos riesgos potenciales, los operadores pueden mejorar aún más la solidez y la rentabilidad de las estrategias mediante la implementación de las medidas de optimización recomendadas. La estrategia es especialmente adecuada para los operadores que buscan una forma de negociación sistematizada, disciplinada y con riesgo controlado.
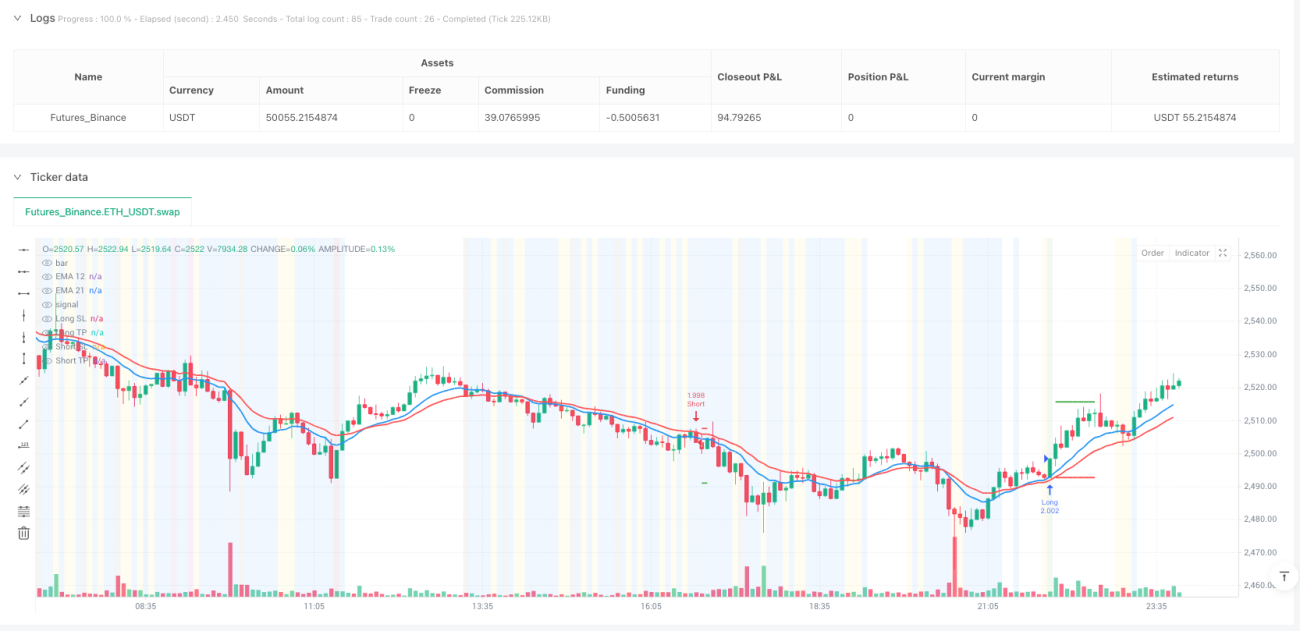
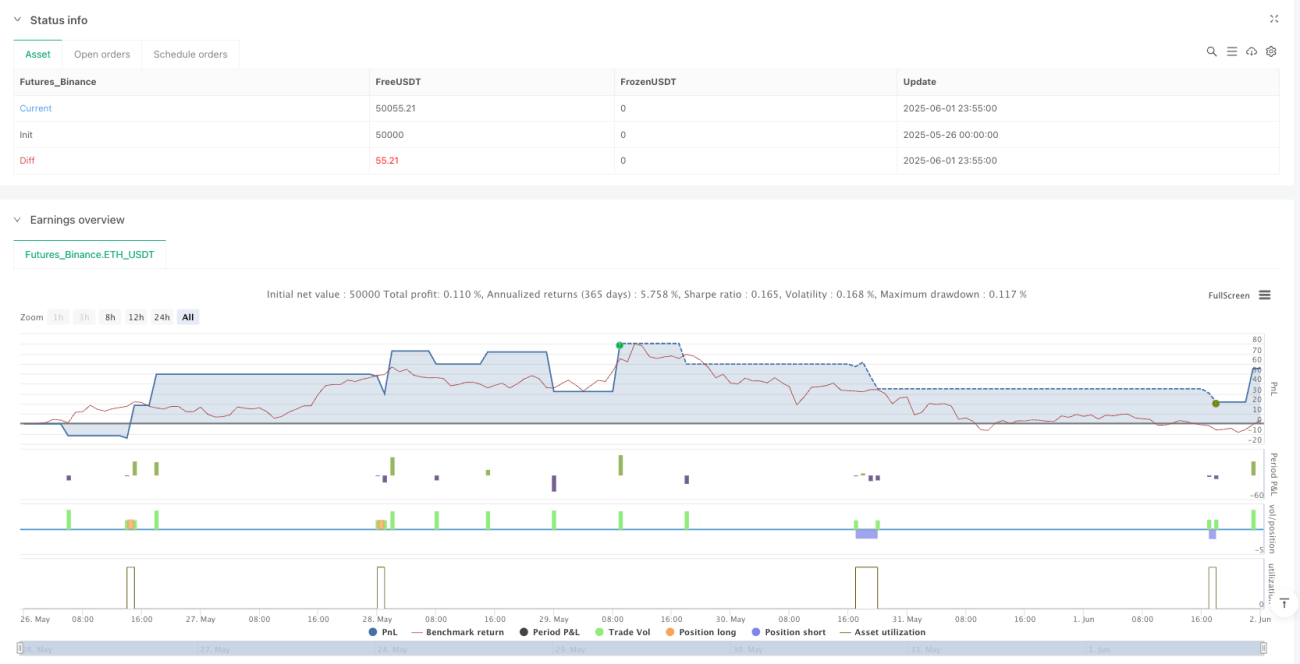
/*backtest
start: 2025-05-26 00:00:00
end: 2025-06-02 00:00:00
period: 5m
basePeriod: 5m
exchanges: [{"eid":"Futures_Binance","currency":"ETH_USDT"}]
*/
//@version=5
strategy("Enhanced EMA Band Rejection Strategy", overlay=true, initial_capital=10000, default_qty_type=strategy.percent_of_equity, default_qty_value=10)
// Input parameters
ema12_length = input.int(12, title="EMA 12 Length")
ema21_length = input.int(21, title="EMA 21 Length")
max_wick_percent = input.float(2.0, title="Max Wick % at High/Low", minval=0.0, maxval=10.0)
risk_reward_ratio = input.float(3.0, title="Risk/Reward Ratio (R)", minval=1.0, maxval=10.0)
trend_consistency_bars = input.int(5, title="Trend Consistency Required (Bars)", minval=1, maxval=20)
// Notification Settings
enable_notifications = input.bool(true, title="Enable Notifications", group="Notifications")
notify_on_entry = input.bool(true, title="Notify on Trade Entry", group="Notifications")
notify_on_exit = input.bool(true, title="Notify on Trade Exit", group="Notifications")
notify_on_setup = input.bool(false, title="Notify on Potential Setup (Pre-Entry)", group="Notifications")
notify_on_failed_conditions = input.bool(false, title="Notify on Failed Conditions", group="Notifications")
// Calculate EMAs
ema12 = ta.ema(close, ema12_length)
ema21 = ta.ema(close, ema21_length)
// Determine upper and lower EMA bands
ema_upper = math.max(ema12, ema21)
ema_lower = math.min(ema12, ema21)
// Plot EMAs
plot(ema12, color=color.blue, linewidth=2, title="EMA 12")
plot(ema21, color=color.red, linewidth=2, title="EMA 21")
// Calculate candle components
body_size = math.abs(close - open)
upper_wick = high - math.max(open, close)
lower_wick = math.min(open, close) - low
candle_range = high - low
// Calculate wick percentages
upper_wick_percent = candle_range > 0 ? (upper_wick / candle_range) * 100 : 0
lower_wick_percent = candle_range > 0 ? (lower_wick / candle_range) * 100 : 0
// Determine EMA trend direction
ema_bullish = ema12 > ema21 // Green bands - bullish trend
ema_bearish = ema12 < ema21 // Red bands - bearish trend
// Check trend consistency for required number of bars
bullish_consistency_check = true
bearish_consistency_check = true
for i = 0 to trend_consistency_bars - 1
ema12_past = ta.ema(close[i], ema12_length)
ema21_past = ta.ema(close[i], ema21_length)
if ema12_past <= ema21_past
bullish_consistency_check := false
if ema12_past >= ema21_past
bearish_consistency_check := false
// Final trend conditions with consistency requirement
ema_bullish_consistent = ema_bullish and bullish_consistency_check
ema_bearish_consistent = ema_bearish and bearish_consistency_check
// NEW RULE: Previous candle close position relative to bands
prev_close_above_upper_band = close[1] > ema_upper[1]
prev_close_below_lower_band = close[1] < ema_lower[1]
prev_close_within_bands = close[1] >= ema_lower[1] and close[1] <= ema_upper[1]
// Long setup conditions (only when EMAs are bullish/green consistently)
long_wick_condition = low <= ema_lower or (low <= ema_upper and low >= ema_lower)
long_body_condition = body_size >= lower_wick
long_wick_percent_condition = upper_wick_percent <= max_wick_percent
long_bullish_candle = close > open
long_trend_condition = ema_bullish_consistent // Only long when bands are consistently green
long_close_above_bands = close > ema_upper // NEW: Close must be above both EMAs
// Previous candle must not have closed below the lower band
long_prev_close_condition = not prev_close_below_lower_band
long_setup = long_wick_condition and long_body_condition and long_wick_percent_condition and long_bullish_candle and long_trend_condition and long_close_above_bands and long_prev_close_condition
// Short setup conditions (only when EMAs are bearish/red consistently)
short_wick_condition = high >= ema_upper or (high >= ema_lower and high <= ema_upper)
short_body_condition = body_size >= upper_wick
short_wick_percent_condition = lower_wick_percent <= max_wick_percent
short_bearish_candle = close < open
short_trend_condition = ema_bearish_consistent // Only short when bands are consistently red
short_close_below_bands = close < ema_lower // NEW: Close must be below both EMAs
// Previous candle must not have closed above the upper band
short_prev_close_condition = not prev_close_above_upper_band
short_setup = short_wick_condition and short_body_condition and short_wick_percent_condition and short_bearish_candle and short_trend_condition and short_close_below_bands and short_prev_close_condition
// Entry conditions
var float long_sl = na
var float short_sl = na
var float long_tp = na
var float short_tp = na
if long_setup and strategy.position_size == 0
strategy.entry("Long", strategy.long)
long_sl := low
risk_amount = close - long_sl
long_tp := close + (risk_amount * risk_reward_ratio)
label.new(bar_index, low, "LONG", style=label.style_label_up, color=color.green, size=size.small)
// Entry Notification
if enable_notifications and notify_on_entry
alert("🟢 LONG ENTRY SIGNAL\n" +
"Symbol: " + syminfo.ticker + "\n" +
"Price: " + str.tostring(close, "#.####") + "\n" +
"Stop Loss: " + str.tostring(long_sl, "#.####") + "\n" +
"Take Profit: " + str.tostring(long_tp, "#.####") + "\n" +
"Risk/Reward: " + str.tostring(risk_reward_ratio, "#.##") + "R\n" +
"Time: " + str.tostring(time), alert.freq_once_per_bar)
if short_setup and strategy.position_size == 0
strategy.entry("Short", strategy.short)
short_sl := high
risk_amount = short_sl - close
short_tp := close - (risk_amount * risk_reward_ratio)
label.new(bar_index, high, "SHORT", style=label.style_label_down, color=color.red, size=size.small)
// Entry Notification
if enable_notifications and notify_on_entry
alert("🔴 SHORT ENTRY SIGNAL\n" +
"Symbol: " + syminfo.ticker + "\n" +
"Price: " + str.tostring(close, "#.####") + "\n" +
"Stop Loss: " + str.tostring(short_sl, "#.####") + "\n" +
"Take Profit: " + str.tostring(short_tp, "#.####") + "\n" +
"Risk/Reward: " + str.tostring(risk_reward_ratio, "#.##") + "R\n" +
"Time: " + str.tostring(time), alert.freq_once_per_bar)
// Exit conditions with fixed R:R
if strategy.position_size > 0
// Long position - fixed stop loss and take profit
strategy.exit("Long Exit", "Long", stop=long_sl, limit=long_tp)
// Exit Notifications
if enable_notifications and notify_on_exit
if close <= long_sl
alert("🛑 LONG STOP LOSS HIT\n" +
"Symbol: " + syminfo.ticker + "\n" +
"Exit Price: " + str.tostring(close, "#.####") + "\n" +
"Loss: " + str.tostring(close - strategy.position_avg_price, "#.####") + "\n" +
"Time: " + str.tostring(time), alert.freq_once_per_bar)
if close >= long_tp
alert("🎯 LONG TAKE PROFIT HIT\n" +
"Symbol: " + syminfo.ticker + "\n" +
"Exit Price: " + str.tostring(close, "#.####") + "\n" +
"Profit: " + str.tostring(close - strategy.position_avg_price, "#.####") + "\n" +
"Time: " + str.tostring(time), alert.freq_once_per_bar)
if strategy.position_size < 0
// Short position - fixed stop loss and take profit
strategy.exit("Short Exit", "Short", stop=short_sl, limit=short_tp)
// Exit Notifications
if enable_notifications and notify_on_exit
if close >= short_sl
alert("🛑 SHORT STOP LOSS HIT\n" +
"Symbol: " + syminfo.ticker + "\n" +
"Exit Price: " + str.tostring(close, "#.####") + "\n" +
"Loss: " + str.tostring(strategy.position_avg_price - close, "#.####") + "\n" +
"Time: " + str.tostring(time), alert.freq_once_per_bar)
if close <= short_tp
alert("🎯 SHORT TAKE PROFIT HIT\n" +
"Symbol: " + syminfo.ticker + "\n" +
"Exit Price: " + str.tostring(close, "#.####") + "\n" +
"Profit: " + str.tostring(strategy.position_avg_price - close, "#.####") + "\n" +
"Time: " + str.tostring(time), alert.freq_once_per_bar)
// Plot stop levels and take profit levels
plot(strategy.position_size > 0 ? long_sl : na, color=color.red, linewidth=2, style=plot.style_line, title="Long SL")
plot(strategy.position_size < 0 ? short_sl : na, color=color.red, linewidth=2, style=plot.style_line, title="Short SL")
plot(strategy.position_size > 0 ? long_tp : na, color=color.green, linewidth=2, style=plot.style_line, title="Long TP")
plot(strategy.position_size < 0 ? short_tp : na, color=color.green, linewidth=2, style=plot.style_line, title="Short TP")
// Additional Notification Logic
// Potential Setup Notifications (when most conditions are met but not all)
long_potential_setup = long_wick_condition and long_body_condition and long_wick_percent_condition and long_bullish_candle and long_trend_condition and long_prev_close_condition and not long_close_above_bands
short_potential_setup = short_wick_condition and short_body_condition and short_wick_percent_condition and short_bearish_candle and short_trend_condition and short_prev_close_condition and not short_close_below_bands
if enable_notifications and notify_on_setup and strategy.position_size == 0
if long_potential_setup
alert("⚠️ POTENTIAL LONG SETUP\n" +
"Symbol: " + syminfo.ticker + "\n" +
"Price: " + str.tostring(close, "#.####") + "\n" +
"Status: Close needs to be above " + str.tostring(ema_upper, "#.####") + "\n" +
"Current Close: " + str.tostring(close, "#.####") + "\n" +
"Time: " + str.tostring(time), alert.freq_once_per_bar)
if short_potential_setup
alert("⚠️ POTENTIAL SHORT SETUP\n" +
"Symbol: " + syminfo.ticker + "\n" +
"Price: " + str.tostring(close, "#.####") + "\n" +
"Status: Close needs to be below " + str.tostring(ema_lower, "#.####") + "\n" +
"Current Close: " + str.tostring(close, "#.####") + "\n" +
"Time: " + str.tostring(time), alert.freq_once_per_bar)
// Failed Conditions Notifications (for debugging)
if enable_notifications and notify_on_failed_conditions and strategy.position_size == 0
if long_wick_condition and long_body_condition and long_wick_percent_condition and long_bullish_candle and not long_trend_condition
alert("❌ LONG SETUP FAILED\n" +
"Symbol: " + syminfo.ticker + "\n" +
"Reason: " + (not ema_bullish ? "EMA trend bearish" : "EMA trend not consistent") + "\n" +
"EMA12: " + str.tostring(ema12, "#.####") + "\n" +
"EMA21: " + str.tostring(ema21, "#.####") + "\n" +
"Time: " + str.tostring(time), alert.freq_once_per_bar)
if short_wick_condition and short_body_condition and short_wick_percent_condition and short_bearish_candle and not short_trend_condition
alert("❌ SHORT SETUP FAILED\n" +
"Symbol: " + syminfo.ticker + "\n" +
"Reason: " + (not ema_bearish ? "EMA trend bullish" : "EMA trend not consistent") + "\n" +
"EMA12: " + str.tostring(ema12, "#.####") + "\n" +
"EMA21: " + str.tostring(ema21, "#.####") + "\n" +
"Time: " + str.tostring(time), alert.freq_once_per_bar)
bgcolor(long_setup ? color.new(color.green, 90) : na, title="Long Setup")
bgcolor(short_setup ? color.new(color.red, 90) : na, title="Short Setup")
// Show when previous close condition fails
bgcolor(long_wick_condition and long_body_condition and long_wick_percent_condition and long_bullish_candle and long_trend_condition and prev_close_below_lower_band ? color.new(color.orange, 95) : na, title="Long Rejected by Prev Close")
bgcolor(short_wick_condition and short_body_condition and short_wick_percent_condition and short_bearish_candle and short_trend_condition and prev_close_above_upper_band ? color.new(color.orange, 95) : na, title="Short Rejected by Prev Close")
// Detailed debugging for failed conditions
long_all_conditions_except_prev = long_wick_condition and long_body_condition and long_wick_percent_condition and long_bullish_candle and long_trend_condition and long_close_above_bands
bgcolor(long_all_conditions_except_prev and prev_close_below_lower_band ? color.new(color.purple, 90) : na, title="Long Failed: Prev Close Below Band")
bgcolor(long_wick_condition and not long_body_condition ? color.new(color.yellow, 90) : na, title="Long Failed: Body Too Small")
bgcolor(long_wick_condition and long_body_condition and not long_wick_percent_condition ? color.new(color.blue, 90) : na, title="Long Failed: Upper Wick Too Big")
bgcolor(long_wick_condition and long_body_condition and long_wick_percent_condition and not long_bullish_candle ? color.new(color.gray, 90) : na, title="Long Failed: Not Bullish Candle")
bgcolor(long_wick_condition and long_body_condition and long_wick_percent_condition and long_bullish_candle and ema_bullish and not ema_bullish_consistent ? color.new(color.fuchsia, 90) : na, title="Long Failed: Trend Not Consistent")
bgcolor(long_wick_condition and long_body_condition and long_wick_percent_condition and long_bullish_candle and not ema_bullish ? color.new(color.maroon, 90) : na, title="Long Failed: EMA Trend Bearish")
bgcolor(long_wick_condition and long_body_condition and long_wick_percent_condition and long_bullish_candle and long_trend_condition and not long_close_above_bands ? color.new(color.lime, 90) : na, title="Long Failed: Close Not Above Bands")
// Similar debugging for shorts
short_all_conditions_except_prev = short_wick_condition and short_body_condition and short_wick_percent_condition and short_bearish_candle and short_trend_condition and short_close_below_bands
bgcolor(short_all_conditions_except_prev and prev_close_above_upper_band ? color.new(color.purple, 90) : na, title="Short Failed: Prev Close Above Band")
bgcolor(short_wick_condition and short_body_condition and short_wick_percent_condition and short_bearish_candle and short_trend_condition and not short_close_below_bands ? color.new(color.aqua, 90) : na, title="Short Failed: Close Not Below Bands")
// Enhanced table for debugging
if barstate.islast
var table debug_table = table.new(position.top_right, 2, 19, bgcolor=color.white, border_width=1)
table.cell(debug_table, 0, 0, "Condition", text_color=color.black, bgcolor=color.gray)
table.cell(debug_table, 1, 0, "Value", text_color=color.black, bgcolor=color.gray)
table.cell(debug_table, 0, 1, "Body Size", text_color=color.black)
table.cell(debug_table, 1, 1, str.tostring(body_size, "#.##"), text_color=color.black)
table.cell(debug_table, 0, 2, "Upper Wick", text_color=color.black)
table.cell(debug_table, 1, 2, str.tostring(upper_wick, "#.##"), text_color=color.black)
table.cell(debug_table, 0, 3, "Lower Wick", text_color=color.black)
table.cell(debug_table, 1, 3, str.tostring(lower_wick, "#.##"), text_color=color.black)
table.cell(debug_table, 0, 4, "Upper Wick %", text_color=color.black)
table.cell(debug_table, 1, 4, str.tostring(upper_wick_percent, "#.##") + "%", text_color=color.black)
table.cell(debug_table, 0, 5, "Lower Wick %", text_color=color.black)
table.cell(debug_table, 1, 5, str.tostring(lower_wick_percent, "#.##") + "%", text_color=color.black)
table.cell(debug_table, 0, 6, "EMA Upper", text_color=color.black)
table.cell(debug_table, 1, 6, str.tostring(ema_upper, "#.##"), text_color=color.black)
table.cell(debug_table, 0, 7, "EMA Lower", text_color=color.black)
table.cell(debug_table, 1, 7, str.tostring(ema_lower, "#.##"), text_color=color.black)
table.cell(debug_table, 0, 8, "R:R Ratio", text_color=color.black)
table.cell(debug_table, 1, 8, str.tostring(risk_reward_ratio, "#.##") + "R", text_color=color.black)
table.cell(debug_table, 0, 9, "Position", text_color=color.black)
table.cell(debug_table, 1, 9, strategy.position_size > 0 ? "LONG" : strategy.position_size < 0 ? "SHORT" : "NONE", text_color=color.black)
// NEW DEBUG INFO
table.cell(debug_table, 0, 10, "Prev Close", text_color=color.black)
table.cell(debug_table, 1, 10, str.tostring(close[1], "#.##"), text_color=color.black)
table.cell(debug_table, 0, 11, "Prev Above Upper", text_color=color.black)
table.cell(debug_table, 1, 11, prev_close_above_upper_band ? "YES" : "NO", text_color=color.black)
table.cell(debug_table, 0, 12, "Prev Below Lower", text_color=color.black)
table.cell(debug_table, 1, 12, prev_close_below_lower_band ? "YES" : "NO", text_color=color.black)
table.cell(debug_table, 0, 13, "Prev Within Bands", text_color=color.black)
table.cell(debug_table, 1, 13, prev_close_within_bands ? "YES" : "NO", text_color=color.black)
// NEW: Trend consistency info
table.cell(debug_table, 0, 14, "Bullish Consistent", text_color=color.black)
table.cell(debug_table, 1, 14, ema_bullish_consistent ? "YES" : "NO", text_color=color.black)
table.cell(debug_table, 0, 15, "Bearish Consistent", text_color=color.black)
table.cell(debug_table, 1, 15, ema_bearish_consistent ? "YES" : "NO", text_color=color.black)
table.cell(debug_table, 0, 16, "Consistency Bars", text_color=color.black)
table.cell(debug_table, 1, 16, str.tostring(trend_consistency_bars), text_color=color.black)
// NEW: Close position relative to bands
table.cell(debug_table, 0, 17, "Close Above Upper", text_color=color.black)
table.cell(debug_table, 1, 17, close > ema_upper ? "YES" : "NO", text_color=color.black)
table.cell(debug_table, 0, 18, "Close Below Lower", text_color=color.black)
table.cell(debug_table, 1, 18, close < ema_lower ? "YES" : "NO", text_color=color.black)