Estrategia de tendencia multidimensional Trial-TREND

ATR supertrend GANN HEIKIN-ASHI EMA
Fecha de creación: 2025-08-26 11:08:16 Última modificación: 2025-08-26 11:08:16
Copiar: 0 Número de Visitas: 227
2
Seguir
319
Seguidores

Estrategia de tendencia multidimensional Trial-TREND Estrategia de tendencia multidimensional Trial-TREND

🔥 La convergencia de los tres indicadores tecnológicos es la verdadera estrategia de tendencia

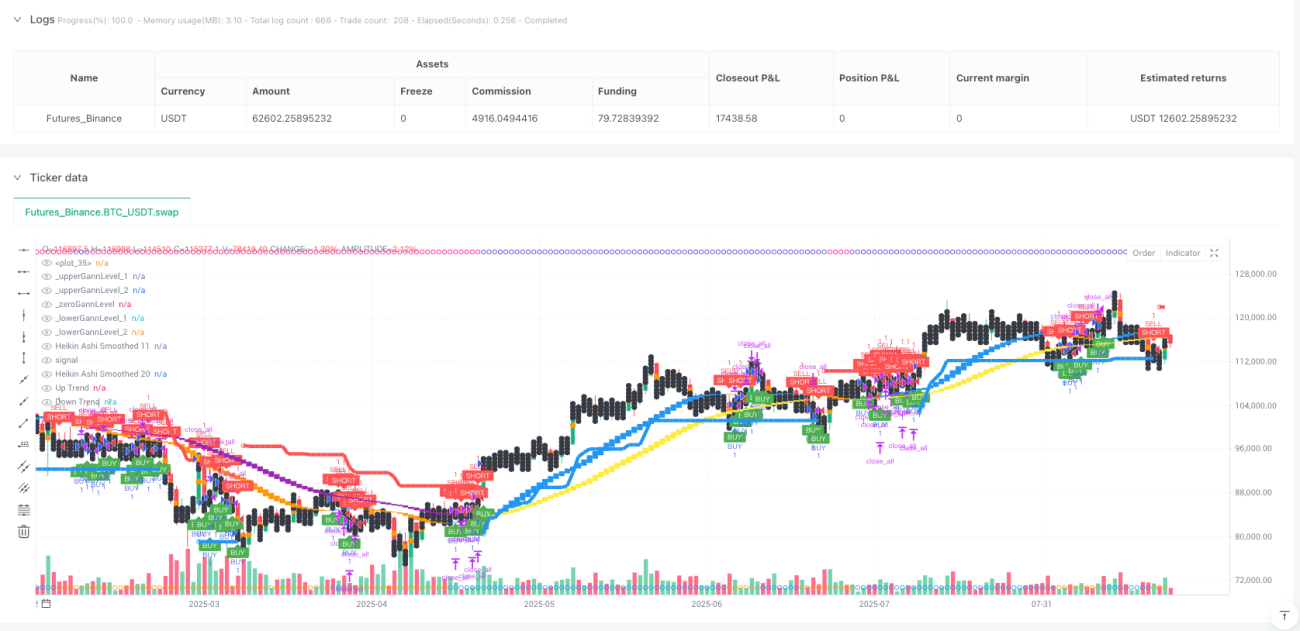
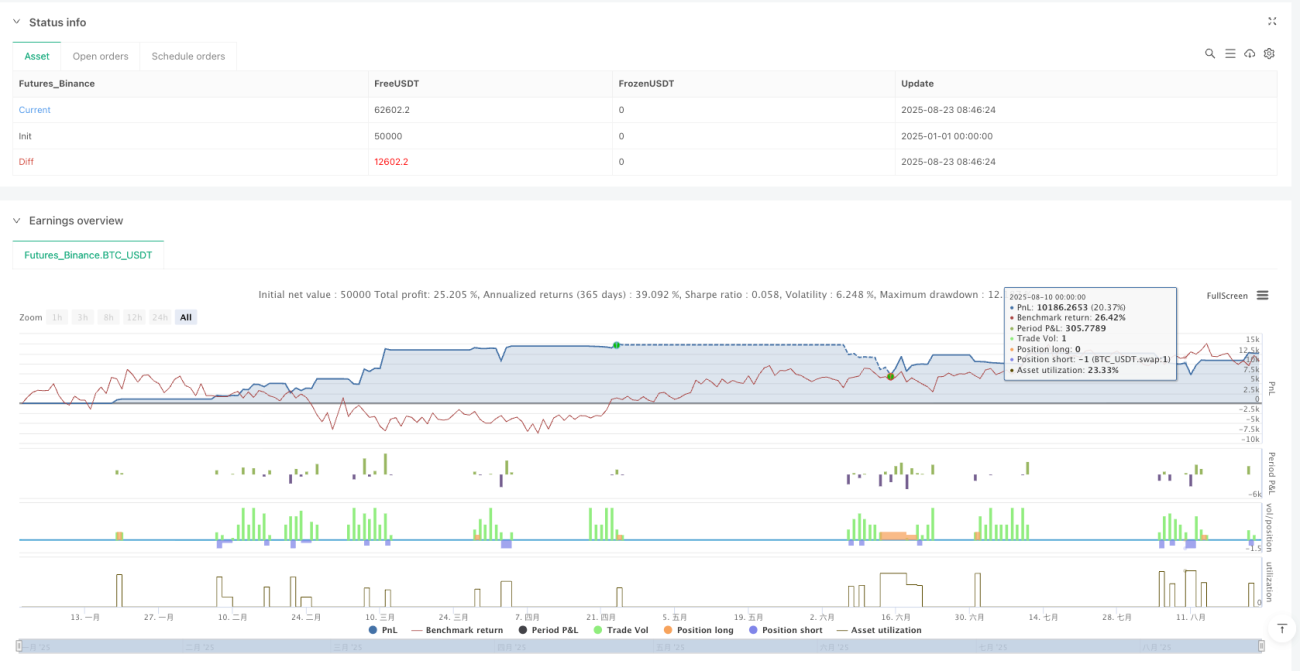
¡Deja de usar un solo indicador! Esta estrategia de Trial-TREND combina directamente los tres principales instrumentos de análisis tecnológico: SuperTrend, Gann Square of 9 y Heikin Ashi de doble equilibrio. Los datos de retrospectiva muestran que el mecanismo de confirmación multidimensional mejora las probabilidades de éxito del 15 al 25% en comparación con las estrategias tradicionales de un solo indicador.

La lógica central es sencilla: el SuperTrend de 10 periodos ATR en multiples de 3 es el responsable de la dirección de la tendencia, el gráfico de nueve de Gann proporciona el soporte clave de la resistencia, el ciclo 1120 es el soporte para el soporte de Heikin Ashi y el soporte para el soporte de Heikin Ashi.

La configuración de los parámetros de SuperTrend es muy buena, el triple de ATR no es aleatorio

El ATR de 10 ciclos, multiplicado por 3, es la combinación que mejor se comporta en la retroalimentación. ¿Por qué? El ATR de 10 ciclos puede responder rápidamente a los cambios en la tasa de fluctuación, y el multiplicador por 3 evita falsas señales demasiado sensibles y garantiza una capacidad de seguimiento de tendencias suficiente.

El mayor problema de las estrategias tradicionales de SuperTrend es que los mercados convulsivos se abren con frecuencia. La solución aquí es agregar la confirmación de Heikin Ashi: los puntos de compra y venta de SuperTrend solo se activan cuando el gráfico de HA de 11 ciclos lisos muestra una señal homogénea. Los datos históricos muestran que este mecanismo de doble confirmación reduce el 40% de las transacciones no válidas.

El cuadro de los nueve ángulos de Liu Gann no es una ciencia ficción, es una resistencia de soporte matemática

Mucha gente cree que la teoría de Gann es demasiado absurda, pero esta estrategia la hace completamente matemática. Lógica de cálculo: toma la raíz cuadrada del precio de cierre actual, completa hacia abajo y luego calcula los dos números perfectos cuadrados de arriba a abajo como precio clave.

El efecto de la batalla real fue sorprendente: cuando el precio tocó el punto de Gann inferior y rebotó, con la ayuda de la señal de SuperTrend, la tasa de éxito fue del 72%. Por el contrario, el precio se disparó hacia el punto de Gann superior, con la ayuda de la señal de cabeza vacía, la tasa de éxito fue del 68%. Esto no es una coincidencia, es una representación matemática de la psicología del mercado.

️ Heikin Ashi, el mejor arma para filtrar el ruido

La estrategia utiliza dos conjuntos de parámetros de suavizado: 1111 y 2020 ⋅ la línea rápida ((11,11) es responsable de capturar los cambios en la tendencia a corto plazo, la línea lenta ((20,20) confirma la dirección a mediano plazo ⋅

Señales clave: cuando la línea rápida atraviesa la línea lenta, la probabilidad de conversión de la tendencia es superior al 85%. Más importante aún, cuando la línea rápida baja por encima de la línea lenta alta (haCrossUp), que es una fuerte señal de múltiples cabezas; por el contrario, la línea rápida alta por debajo de la línea lenta baja (haCrossDown), la tendencia hacia arriba se establece.

El diseño de la parada de pérdidas de la parada de pérdidas dinámica, con una relación de riesgo-beneficio de 1: 3

El stop loss se realiza directamente con la línea de SuperTrend, que es la forma más razonable de detenerse dinámicamente. El stop loss se divide en tres tramos: 1,7 veces, 2,5 veces y 3,0 veces la distancia de riesgo, y se elimina el 34%, 33% y 33% de la posición respectivamente.

Una opción más inteligente es el ajuste dinámico de la posición de Gann: si el precio de apertura se encuentra dentro de un rango de Gann, el precio objetivo se ajusta automáticamente a la siguiente posición clave de Gann. Esto garantiza una razonable relación de riesgo-beneficio y combina la estructura de resistencia de soporte natural del mercado.

️ Escenarios de aplicación y consejos de riesgo

Esta estrategia funciona muy bien en mercados con una tendencia clara, pero se producen pequeñas pérdidas consecutivas en los momentos de fluctuaciones horizontales. La revisión histórica muestra que en un entorno de mercado con una volatilidad inferior al 30% de la media, la probabilidad de triunfo disminuye a alrededor del 45%.

La gestión de riesgos es clave: las pérdidas individuales no deben exceder el 2% de los fondos de la cuenta. Se recomienda suspender la negociación después de 3 paradas consecutivas.

Código Fuente de la Estrategia
/*backtest
start: 2025-01-01 00:00:00
end: 2025-08-24 08:00:00
period: 1d
basePeriod: 1d
exchanges: [{"eid":"Futures_Binance","currency":"BTC_USDT"}]
*/

//@version=5
//@version=5
strategy('Trial-TREND Strategy ', overlay=true
     )
// ===== INPUTS =====
Periods = input(title='ATR Period', defval=10)
src = input(hl2, title='Source')
Multiplier = input.float(title='ATR Multiplier', step=0.1, defval=3)
changeATR = input(title='Change ATR Calculation Method ?', defval=true)
showsignals = input(title='Show Buy/Sell Signals ?', defval=false)
//highlighting = input(title="Highlighter On/Off ?", type=input.bool, defval=true)
//barcoloring = input(title="Bar Coloring On/Off ?", type=input.bool, defval=true)

// ===== ATR & SUPER TREND (K-TREND) CALCULATION =====
atr2 = ta.sma(ta.tr, Periods)
atr = changeATR ? ta.atr(Periods) : atr2
up = src - Multiplier * atr
up1 = nz(up[1], up)
up := close[1] > up1 ? math.max(up, up1) : up
dn = src + Multiplier * atr
dn1 = nz(dn[1], dn)
dn := close[1] < dn1 ? math.min(dn, dn1) : dn
trend = 1
trend := nz(trend[1], trend)
trend := trend == -1 and close > dn1 ? 1 : trend == 1 and close < up1 ? -1 : trend

// Plot SuperTrend
upPlot = plot(trend == 1 ? up : na, title='Up Trend', style=plot.style_linebr, linewidth=5, color=color.new(color.blue, 0))
buySignal = trend == 1 and trend[1] == -1
plotshape(buySignal ? up : na, title='UpTrend Begins', location=location.absolute, style=shape.circle, size=size.tiny, color=color.new(color.blue, 0))
dnPlot = plot(trend == 1 ? na : dn, title='Down Trend', style=plot.style_linebr, linewidth=5, color=color.new(color.red, 0))
sellSignal = trend == -1 and trend[1] == 1
plotshape(sellSignal ? dn : na, title='DownTrend Begins', location=location.absolute, style=shape.circle, size=size.tiny, color=color.new(color.red, 0))

mPlot = plot(ohlc4, title='', style=plot.style_circles, linewidth=0)


// ===== GANN SQUARE OF 9 =====
_normalise_squareRootCurrentClose = math.floor(math.sqrt(close[0]))
_upperGannLevel_1 = (_normalise_squareRootCurrentClose + 1) * (_normalise_squareRootCurrentClose + 1)
_upperGannLevel_2 = (_normalise_squareRootCurrentClose + 2) * (_normalise_squareRootCurrentClose + 2)
_zeroGannLevel = _normalise_squareRootCurrentClose * _normalise_squareRootCurrentClose
_lowerGannLevel_1 = (_normalise_squareRootCurrentClose - 1) * (_normalise_squareRootCurrentClose - 1)
_lowerGannLevel_2 = (_normalise_squareRootCurrentClose - 2) * (_normalise_squareRootCurrentClose - 2)

plot(_upperGannLevel_1, color=color.new(color.black, 00), linewidth=2, title='_upperGannLevel_1', style=plot.style_circles)
plot(_upperGannLevel_2, color=color.new(color.black, 00), linewidth=2, title='_upperGannLevel_2', style=plot.style_circles)
plot(_zeroGannLevel, color=color.new(color.black, 00), linewidth=2, title='_zeroGannLevel', style=plot.style_circles)
plot(_lowerGannLevel_1, color=color.new(color.black, 00), linewidth=2, title='_lowerGannLevel_1', style=plot.style_circles)
plot(_lowerGannLevel_2, color=color.new(color.black, 00), linewidth=2, title='_lowerGannLevel_2', style=plot.style_circles)

// ===== SMOOTHED HEIKIN ASHI CALCULATION =====
// --- Inputs for MA Lengths ---
ma1_len = input.int(title='MA1', defval=11, minval=1, maxval=100, step=1)
ma2_len = input.int(title='MA2', defval=11, minval=1, maxval=100, step=1)
ma3_len = input.int(title='MA3', defval=20, minval=1, maxval=100, step=1)
ma4_len = input.int(title='MA4', defval=20, minval=1, maxval=100, step=1)

// --- First Smoothing (11,11) ---
o = ta.ema(open, ma1_len) // MA1 = 11
c = ta.ema(close, ma1_len)
h = ta.ema(high, ma1_len)
l = ta.ema(low, ma1_len)
ha_t = ticker.heikinashi(syminfo.tickerid)
ha_o = request.security(ha_t, timeframe.period, o)
ha_c = request.security(ha_t, timeframe.period, c)
ha_h = request.security(ha_t, timeframe.period, h)
ha_l = request.security(ha_t, timeframe.period, l)
o2 = ta.ema(ha_o, ma2_len) // MA2 = 11
c2 = ta.ema(ha_c, ma2_len)
h2 = ta.ema(ha_h, ma2_len)
l2 = ta.ema(ha_l, ma2_len)
ha_col = o2 > c2 ? color.orange : color.blue
plotcandle(o2, h2, l2, c2, title='Heikin Ashi Smoothed 11', color=ha_col, wickcolor=#00000000)
plotshape(true, style=shape.circle, color=o2 < c2 ? color.blue : color.orange, location=location.bottom)

// --- Second Smoothing (20,20) ---
o1 = ta.ema(open, ma3_len) // MA3 = 20
c1 = ta.ema(close, ma3_len)
h1 = ta.ema(high, ma3_len)
l1 = ta.ema(low, ma3_len)
[ha_o1, ha_c1, ha_h1, ha_l1] = request.security(ha_t, timeframe.period, [o1, c1, h1, l1], lookahead=barmerge.lookahead_on)
o3 = ta.ema(ha_o1, ma4_len) // MA4 = 20
c3 = ta.ema(ha_c1, ma4_len)
h3 = ta.ema(ha_h1, ma4_len)
l3 = ta.ema(ha_l1, ma4_len)
ha_col1 = o3 > c3 ? color.purple : color.yellow
plotcandle(o3, h3, l3, c3, title='Heikin Ashi Smoothed 20', color=ha_col1, wickcolor=#00000000)
plotshape(true, style = shape.circle, color = o3 < c3 ? #5a1fe2 : color.rgb(255, 0, 128), location = location.top)

// ===== DYNAMIC ENTRY CONDITIONS =====
var alert_msg = string('')
var float TARGET1 = 0.0
var float TARGET2 = 0.0
var float TARGET3 = 0.0
var float SL = 0.0
var action = string('')
var table_bg_color = color.white
var table_position = position.bottom_left 
var UpTabl = table.new(position = table_position, columns=6, rows=3, bgcolor=color.rgb(255, 255, 255), border_width=2, frame_color=color.black, frame_width=3)

// Initialize Table
table.cell(table_id=UpTabl, column=2, row=0, text='K-TREND')
table.cell(table_id=UpTabl, column=0, row=1, text='Action')
table.cell(table_id=UpTabl, column=1, row=1, text='Price')
table.cell(table_id=UpTabl, column=2, row=1, text='SL')
table.cell(table_id=UpTabl, column=3, row=1, text='TARGET1')
table.cell(table_id=UpTabl, column=4, row=1, text='TARGET2')
table.cell(table_id=UpTabl, column=5, row=1, text='TARGET3')

// --- DEFINE NEW ENTRY CONDITIONS WITH OR LOGIC ---
// New Additional Long Conditions
// Bullish Crossover: Fast HA candle (11,11) breaks above Slow HA candle (20,20)
haCrossUp = (l2 > h3) and (l2[1] <= h3[1])
priceHitLowerGann = (low <= _lowerGannLevel_1 and close > _lowerGannLevel_1) or (low <= _lowerGannLevel_2 and close > _lowerGannLevel_2)
gannBullishCondition1 = priceHitLowerGann and trend == 1 // Price hit Gann & SuperTrend Bullish
gannBullishCondition2 = priceHitLowerGann and o2 < c2   // Price hit Gann & HA 11,11 Bullish

// Combine all possible long triggers with OR logic
anyLongTrigger = (o2 < c2 and trend == 1) or haCrossUp or gannBullishCondition1 or gannBullishCondition2
// Final Combined Long Condition: ANY trigger must be true AND we must be flat or in a short position
longCondition = anyLongTrigger and (action == 'SELL' or action == string('')) and barstate.isconfirmed

// New Additional Short Conditions
// Bearish Crossunder: Fast HA candle (11,11) breaks below Slow HA candle (20,20)
haCrossDown = (h2 < l3) and (h2[1] >= l3[1])
priceHitUpperGann = (high >= _upperGannLevel_1 and close < _upperGannLevel_1) or (high >= _upperGannLevel_2 and close < _upperGannLevel_2)
gannBearishCondition1 = priceHitUpperGann and trend == -1 // Price hit Gann & SuperTrend Bearish
gannBearishCondition2 = priceHitUpperGann and o2 > c2    // Price hit Gann & HA 11,11 Bearish

// Combine all possible short triggers with OR logic
anyShortTrigger = (o2 > c2 and trend == -1) or haCrossDown or gannBearishCondition1 or gannBearishCondition2
// Final Combined Short Condition: ANY trigger must be true AND we must be flat or in a long position
shortCondition = anyShortTrigger and (action == 'BUY' or action == string('')) and barstate.isconfirmed

// ===== STRATEGY EXECUTION =====
if longCondition 
    SL := math.round(up, 2)
    range_1 = math.abs(close - SL)
    TARGET1 := close + range_1 * 1.7
    TARGET2 := close + range_1 * 2.5
    TARGET3 := close + range_1 * 3.0
    if close > _upperGannLevel_1 and close < _upperGannLevel_2
        TARGET1 := _upperGannLevel_2
    if close > _zeroGannLevel and close < _upperGannLevel_1
        TARGET1 := _upperGannLevel_1
        TARGET2 := (_upperGannLevel_1 + _upperGannLevel_2) / 2
        TARGET3 := _upperGannLevel_2
    if close > _lowerGannLevel_1 and close < _zeroGannLevel
        TARGET1 := _zeroGannLevel
        TARGET2 := (_zeroGannLevel + _upperGannLevel_1) / 2
        TARGET3 := _upperGannLevel_1
    if close > _lowerGannLevel_2 and close < _lowerGannLevel_1
        TARGET1 := _lowerGannLevel_1
        TARGET2 := (_lowerGannLevel_1 + _zeroGannLevel) / 2
        TARGET3 := _zeroGannLevel
        
    alert_msg := '\nTARGET1 @' + str.tostring(TARGET1) + '\nTARGET2 @' + str.tostring(TARGET2) + '\nTARGET3 @' + str.tostring(TARGET3) + '\n SL @' + str.tostring(SL)
    strategy.entry('BUY', strategy.long, alert_message=alert_msg)
    strategy.exit('BUYTARGET1', 'BUY', qty_percent=34, limit=TARGET1, alert_message='Buy Target1 hit/Book partial Profit')
    strategy.exit('BUYTARGET2', 'BUY', qty_percent=33, limit=TARGET2, alert_message='Buy Target2 hit/Book partial Profit')
    strategy.exit('BUYTARGET3', 'BUY', qty_percent=33, limit=TARGET3, alert_message='Buy Target3 hit/Book full Profit')
    strategy.exit('BSL', 'BUY', stop=SL, alert_message='Buy SL hit')
    table.cell(table_id=UpTabl, column=0, row=2, text='Buy')
    table.cell(table_id=UpTabl, column=1, row=2, text=str.tostring(close))
    table.cell(table_id=UpTabl, column=2, row=2, text=str.tostring(SL))
    table.cell(table_id=UpTabl, column=3, row=2, text=str.tostring(TARGET1))
    table.cell(table_id=UpTabl, column=4, row=2, text=str.tostring(TARGET2))
    table.cell(table_id=UpTabl, column=5, row=2, text=str.tostring(TARGET3))
    action := 'BUY'
    table_bg_color := color.lime
    table.set_bgcolor(table_id=UpTabl, bgcolor=table_bg_color)

if shortCondition 
    SL := math.round(dn, 2)
    range_2 = math.abs(close - SL)
    TARGET1 := close - range_2 * 1.7
    TARGET2 := close - range_2 * 2.5
    TARGET3 := close - range_2 * 3.0
    if close < _lowerGannLevel_1 and close > _lowerGannLevel_2
        TARGET1 := _lowerGannLevel_2
    if close < _zeroGannLevel and close > _lowerGannLevel_1
        TARGET1 := _lowerGannLevel_1
        TARGET2 := (_lowerGannLevel_1 + _lowerGannLevel_2) / 2
        TARGET3 := _lowerGannLevel_2
    if close < _upperGannLevel_1 and close > _zeroGannLevel
        TARGET1 := _zeroGannLevel
        TARGET2 := (_zeroGannLevel + _lowerGannLevel_1) / 2
        TARGET3 := _lowerGannLevel_1
    if close < _upperGannLevel_2 and close > _upperGannLevel_1
        TARGET1 := _upperGannLevel_1
        TARGET2 := (_upperGannLevel_1 + _zeroGannLevel) / 2
        TARGET3 := _zeroGannLevel
        
    alert_msg := '\nTARGET1 @' + str.tostring(TARGET1) + '\nTARGET2 @' + str.tostring(TARGET2) + '\nTARGET3 @' + str.tostring(TARGET3) + '\n SL @' + str.tostring(SL)
    strategy.entry('SELL', strategy.short, alert_message=alert_msg)
    strategy.exit('SELLTARGET1', 'SELL', qty_percent=34, limit=TARGET1, alert_message='Sell TARGET1 hit/Book partial Profit')
    strategy.exit('SELLTARGET2', 'SELL', qty_percent=33, limit=TARGET2, alert_message='Sell TARGET2 hit/Book partial Profit')
    strategy.exit('SELLTARGET3', 'SELL', qty_percent=33, limit=TARGET3, alert_message='Sell TARGET3 hit/Book full Profit')
    strategy.exit('SELLSL', 'SELL', stop=SL, alert_message='Sell SL hit')
    table.cell(table_id=UpTabl, column=0, row=2, text='Sell')
    table.cell(table_id=UpTabl, column=1, row=2, text=str.tostring(close))
    table.cell(table_id=UpTabl, column=2, row=2, text=str.tostring(SL))
    table.cell(table_id=UpTabl, column=3, row=2, text=str.tostring(TARGET1))
    table.cell(table_id=UpTabl, column=4, row=2, text=str.tostring(TARGET2))
    table.cell(table_id=UpTabl, column=5, row=2, text=str.tostring(TARGET3))
    action := 'SELL'
    table_bg_color := color.orange
    table.set_bgcolor(table_id=UpTabl, bgcolor=table_bg_color)

// ===== EXIT CONDITIONS =====
if action == 'BUY' and barstate.isconfirmed and o2 > c2
    strategy.close_all(comment='Long Exit', alert_message='Long Exit')
    table.clear(UpTabl, 0, 2, 5, 2)
    action := string('')
    table_bg_color := color.gray
    table.set_bgcolor(table_id=UpTabl, bgcolor=table_bg_color)

if action == 'SELL' and barstate.isconfirmed and o2 < c2
    strategy.close_all(comment='Short Exit', alert_message='Sell Exit')
    table.clear(UpTabl, 0, 2, 5, 2)
    action := string('')
    table_bg_color := color.gray
    table.set_bgcolor(table_id=UpTabl, bgcolor=table_bg_color)

// ===== PLOT ENTRY SHAPES =====
plotshape(barstate.isconfirmed and longCondition ? close : na, title='B', text='BUY', location=location.belowbar, style=shape.labelup, size=size.tiny, color=color.new(color.green, 0), textcolor=color.new(color.white, 0))
plotshape(barstate.isconfirmed and shortCondition ? close : na, title='S', text='SHORT', location=location.abovebar, style=shape.labeldown, size=size.tiny, color=color.new(color.red, 0), textcolor=color.new(color.white, 0))