robot inteligente de inversión fija

EMA MACD RSI BB
Fecha de creación: 2025-10-23 16:23:41 Última modificación: 2025-10-23 16:23:41
Copiar: 0 Número de Visitas: 198
2
Seguir
329
Seguidores

robot inteligente de inversión fija robot inteligente de inversión fija

¡Esto no es un pronóstico ordinario, es un robot pronóstico que piensa!

¿Sabías que la mayoría de las personas que hacen inversiones programadas son “compradores sin cerebro”, pero esta estrategia es como tener un asistente de inversión súper inteligente! Ajusta el monto de cada compra según las condiciones del mercado, de un 5% inicial a un máximo de 100%. ¡Como si fueras al mercado de verduras y compraras más cuando es barato y menos cuando es caro, simple y grosero pero súper efectivo!

La combinación de los cuatro indicadores tecnológicos, la tendencia del mercado es evidente

La estrategia utiliza una combinación de cuatro indicadores técnicos:
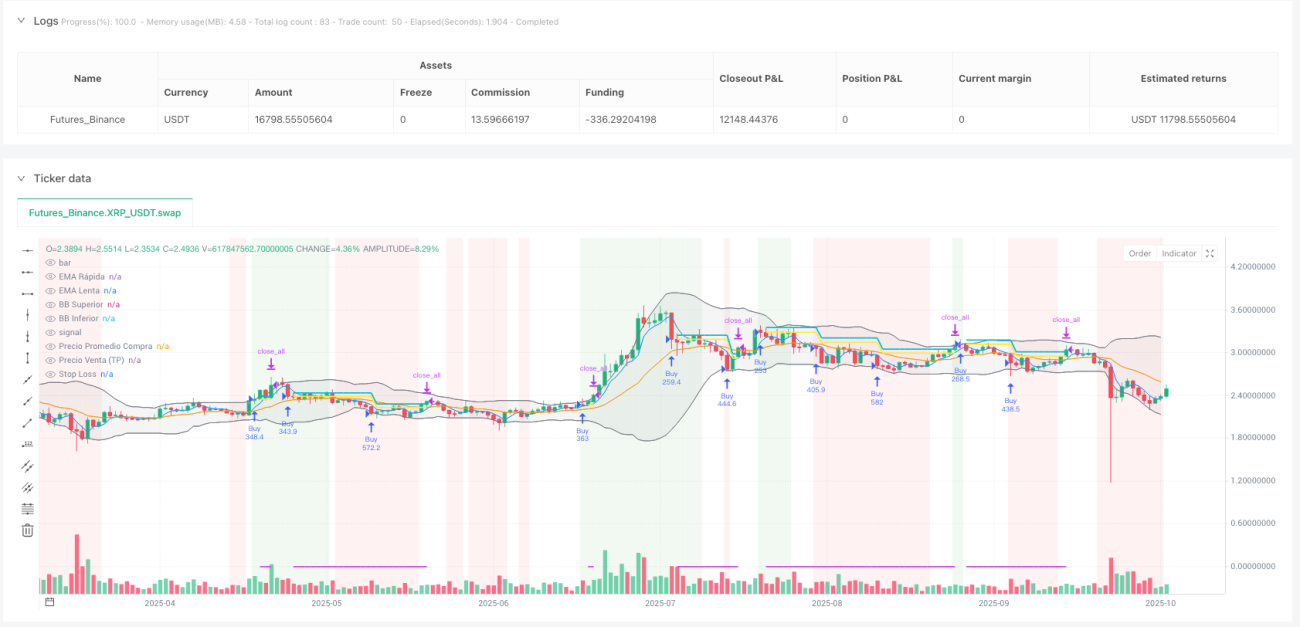
  • La línea media de la EMAEl mercado de la electricidad cardíaca, que indica la dirección de las tendencias
  • MACDEl “monitoreo de lluvia” de la dinámica del mercado, para determinar el momento de comprar y vender
  • RSIEl “temperatura” de la sobrecompra y la sobreventa, para evitar la persecución de los altos y bajos
  • El cinturón de Bryn“Zona de seguridad” para las fluctuaciones de los precios, según la resistencia de soporte

Los cuatro indicadores se combinan para formar una “alianza de los vengadores”, cada uno con sus propias funciones, pero en silencio.

La lógica de la hipoteca inteligente de las compras y las caídas

El mayor problema de las apuestas ordinarias es que no controlan las posiciones, y esta estrategia es más inteligente:

  • La primera vez que compré agua de prueba con un 5%.
  • Incremento de 2,5% en la inversión por cada incremento de depósito
  • La diferencia entre los aumentos y las caídas es mayor (de 2%, 6%, 10%…)
  • No más del 100% de la inversión total en una sola inversión

Es como jugar a un juego de actualización, más tarde se invierte más, pero el riesgo se controla hasta la muerte!

La buena idea es detener las pérdidas, dejar que las ganancias corran y dejar que las pérdidas se detengan.

La estrategia es vender la lógica de la superhumanización:

  • Un mínimo de 2% de ganancias para considerar la ventaEn el blog de la organización, el autor de la imagen, el blogger y activista, el periodista y activista de derechos civiles, el periodista y activista de derechos civiles, el periodista y activista de derechos civiles, el periodista y activista de derechos civiles.
  • El cambio de tendencia se detuvo a tiempo“Ahora que ya no hay nada que hacer, no hay nada que hacer”.
  • La caída del precio del 2% provocó la ventaLa protección de las ganancias no se devuelve.
  • Línea de pérdidas ajustableAunque por defecto es 100% (basicamente no se activa), puede ajustarse según su capacidad de asumir riesgos.

En pocas palabras, la estrategia es “no ser débil cuando se gana dinero, no enamorarse cuando se corre”.

||

🤖 This Isn’t Ordinary DCA - It’s a Thinking DCA Robot!

You know what? Most people do dollar-cost averaging like mindless “buy-buy-buy” machines, but this strategy is like having a super-smart investment assistant! It adjusts the purchase amount based on market conditions, starting from 5% and gradually increasing up to 100%. It’s like shopping at a farmers market - buy more when it’s cheap, buy less when it’s expensive. Simple, brutal, but incredibly effective!

📊 Four Technical Indicators Working as a Team

Key point! This strategy uses a combination of four technical indicators:

  • Fast/Slow EMA: Like the market’s “heartbeat monitor,” showing trend direction
  • MACD: The market momentum “barometer” for timing entries and exits
  • RSI: The overbought/oversold “thermometer” to avoid chasing highs and selling lows
  • Bollinger Bands: Price volatility “safety zones” for support and resistance

These four indicators work together like assembling the “Avengers” - each has their role but they coordinate perfectly!

💡 Smart Pyramiding Logic: Buy More as It Drops

Pitfall alert! The biggest problem with regular DCA is poor position sizing control. This strategy is much smarter:

  • Initial purchase uses 5% of capital to test the waters
  • Each additional purchase increases by 2.5%
  • The more price drops, the larger the spacing between purchases (2%, 6%, 10%…)
  • Maximum single investment never exceeds 100% of total capital

It’s like leveling up in a video game - the investment gets bigger as you progress, but risk is tightly controlled!

🎯 Smart Take-Profit and Stop-Loss: Let Profits Run, Cut Losses Short

This strategy’s exit logic is super user-friendly:

  • Minimum 2% profit before considering sale: No more “working hard for nothing”
  • Exit when trend weakens: Take profits while you can, secure the gains
  • 2% price drop triggers sell signal: Protect profits from giving back
  • Configurable stop-loss: Though default is 100% (basically never triggered), you can adjust based on risk tolerance

Simply put, this strategy is “ruthless when making money, decisive when it’s time to run”!

[/trans]

Código Fuente de la Estrategia
// This Pine Script™ code is subject to the terms of the MPL 2.0 at https://mozilla.org/MPL/2.0/
// © MTB by Neurodoc
// By Nicolás Astorga

//@version=5
strategy("Master Trading Bot by Neurodoc", 
         shorttitle="MTB Adaptation", 
         overlay=true, 
         initial_capital=10000, 
         pyramiding=100,
         commission_value=0.1, 
         commission_type=strategy.commission.percent,
         default_qty_type = strategy.cash)

// —————— CONFIGURATION (Based on ve.env) ——————
// Purchase and DCA Percentages
var GRP_DCA = "DCA Configuration"
start_percentage = input.float(5.0, "Initial Buy Percentage (%)", group=GRP_DCA)
increment_percentage = input.float(2.5, "DCA Increment per Buy (%)", group=GRP_DCA)
max_percentage = input.float(100.0, "Maximum Buy Percentage (%)", group=GRP_DCA)
min_profit_percent = input.float(2.0, "Minimum Profit Percentage for Sell (%)", group=GRP_DCA)

// Stop Loss and Drop Signal
var GRP_RISK = "Risk Management"
stop_loss_percent = input.float(100.0, "Stop Loss (%)", group=GRP_RISK, tooltip="A value of 100 means there is effectively no stop loss, as the price would have to go to zero.")
drop_percent_signal = input.float(2.0, "Price Drop Signal (%)", group=GRP_RISK)

// Indicator Parameters
var GRP_INDICATORS = "Indicator Parameters"
ema_fast_period = input.int(3, "Fast EMA", group=GRP_INDICATORS)
ema_mid_period = input.int(7, "Medium EMA", group=GRP_INDICATORS)
ema_slow_period = input.int(18, "Slow EMA", group=GRP_INDICATORS)
bb_length = input.int(20, "Bollinger Bands Length", group=GRP_INDICATORS)
bb_stddev = input.float(2.0, "Bollinger Bands Std Dev", group=GRP_INDICATORS)
macd_fast = input.int(52, "MACD Fast", group=GRP_INDICATORS)
macd_slow = input.int(200, "MACD Slow", group=GRP_INDICATORS)
macd_signal = input.int(3, "MACD Signal", group=GRP_INDICATORS)
rsi_length = input.int(14, "RSI Length", group=GRP_INDICATORS)
rsi_oversold_threshold = input.int(25, "RSI Oversold (for divergence)", group=GRP_INDICATORS)

// —————— INDICATOR CALCULATIONS ——————
// EMAs
ema_fast = ta.ema(open, ema_fast_period)
ema_mid = ta.ema(open, ema_mid_period)
ema_slow = ta.ema(open, ema_slow_period)

// Bollinger Bands
[bb_middle, bb_upper, bb_lower] = ta.bb(close, bb_length, bb_stddev)
bb_width = (bb_upper - bb_lower) / bb_middle * 100
is_bb_expanding = bb_width > bb_width[1]

// MACD
[macd_line, signal_line, _] = ta.macd(close, macd_fast, macd_slow, macd_signal)

// RSI
rsi = ta.rsi(close, rsi_length)

// Price drop signal from recent highest price (equivalent to `cummax` in Python)
highest_price = ta.highest(high, 500) // 500-bar lookback as an approximation of all-time high
price_drop_percent = ((highest_price - close) / highest_price) * 100
is_price_drop_signal = price_drop_percent >= drop_percent_signal

// —————— TRADING LOGIC ——————
// Trend Conditions
is_bullish = ema_fast > ema_slow and macd_line > signal_line and close > bb_middle
is_bearish = ema_fast < ema_slow and macd_line < signal_line and close < bb_middle
is_weakening = rsi < rsi[1]

// Strategy state variables
var bool just_sold = false
var int dca_step = 0

// Determine the capital percentage for the next buy
dca_buy_percentage = start_percentage + (dca_step * increment_percentage)
if dca_buy_percentage > max_percentage
    dca_buy_percentage := max_percentage

avg_buy_price = strategy.position_avg_price

// Long Entry Condition
// Initial Buy (no open position)
long_signal_initial = strategy.position_size == 0 and is_bullish and macd_line > signal_line and rsi < 65

// DCA (if already in position)
price_drop_from_avg = ((avg_buy_price - close) / avg_buy_price) * 100
dca_required_drop = 2.0 + (dca_step * 4.0) // Logic equivalent to DCA_PRICE_DROP_START and INCREMENT
long_signal_dca = strategy.position_size > 0 and is_bearish and close < avg_buy_price and price_drop_from_avg >= dca_required_drop

// Manage `just_sold` state
if strategy.position_size > 0
    just_sold := false
if strategy.position_size == 0 and strategy.position_size[1] > 0
    just_sold := true

// Avoid immediate rebuying after selling unless strong bullish condition
long_signal = (just_sold and is_bullish) ? long_signal_initial : (not just_sold ? (long_signal_initial or long_signal_dca) : false)

// Sell/Close Condition
current_profit_percent = ((close - avg_buy_price) / avg_buy_price) * 100
has_min_profit = current_profit_percent >= min_profit_percent
stop_loss_price = avg_buy_price * (1 - stop_loss_percent / 100)
is_stoploss_triggered = close <= stop_loss_price

short_signal = strategy.position_size > 0 and has_min_profit and ((is_bearish and is_weakening) or is_price_drop_signal or is_stoploss_triggered or (macd_line < signal_line))

// —————— ORDER EXECUTION ——————

if (long_signal)
    // Calculate how much money (e.g., USDT) to invest in this trade
    cash_to_invest = (strategy.equity * dca_buy_percentage / 100) / close
    strategy.entry("Buy", strategy.long, qty=cash_to_invest) // "qty" represents a cash-based position
    dca_step := dca_step + 1
        
if (short_signal)
    strategy.close_all(comment="Sell")
    dca_step := 0 // Reset DCA counter upon selling

// —————— CHART VISUALIZATION ——————
// Background color by trend
bgcolor(is_bullish ? color.new(color.green, 90) : is_bearish ? color.new(color.red, 90) : na)

// Plot EMAs and Bollinger Bands
plot(ema_fast, "Fast EMA", color.blue)
plot(ema_slow, "Slow EMA", color.orange)
p1 = plot(bb_upper, "Upper BB", color=color.gray)
p2 = plot(bb_lower, "Lower BB", color=color.gray)
fill(p1, p2, color=color.new(color.gray, 90))

// Plot average buy price if position is open
plot(strategy.position_size > 0 ? avg_buy_price : na, "Average Buy Price", color.yellow, style=plot.style_linebr, linewidth=2)

// Plot take-profit target
plot(strategy.position_size > 0 ? avg_buy_price * (1 + min_profit_percent / 100) : na, "Sell Target (TP)", color.aqua, style=plot.style_linebr, linewidth=2)

// Plot stop loss level
plot(strategy.position_size > 0 ? stop_loss_price : na, "Stop Loss", color.fuchsia, style=plot.style_linebr, linewidth=2)