Cazador de liquidez en oro

🎯 ¿Qué hace realmente esta estrategia?
¿Sabías? En el mercado, hay un grupo de "dinero inteligente" que siempre tiende trampas en niveles clave. Esta estrategia actúa como un cazador experimentado, especializado en identificar esas trampas y operar en sentido contrario. En pocas palabras, cuando el precio hace una "falsa ruptura" de un soporte o resistencia importante y luego vuelve rápidamente, ¡entramos siguiendo el ritmo del capital grande!
📊 Revelación del sistema de triple filtro
¡Atención! Esta estrategia utiliza tres capas de protección:
🔸 Filtro de tendencia: La EMA de 200 períodos actúa como un conductor experimentado que te indica si el camino es cuesta arriba o cuesta abajo.
🔸 Identificación de niveles clave: Encuentra automáticamente los niveles de soporte y resistencia que son "campos de batalla obligados".
🔸 Detección de barrido de liquidez: Captura los "fintazos" creados intencionalmente por el capital grande.
Es como pescar: debes saber dónde están los peces, qué cebo usar y cuándo recoger la caña.
🎪 El encanto mágico del barrido de liquidez
Imagina esto: estás haciendo cola para comprar un té con leche y de repente alguien grita "¡Gratis!" Todos se lanzan, pero resulta que es falso, mientras que los inteligentes ya se han colado al frente.
¡El mercado funciona igual! Primero, el precio "finge" romper un soporte (barriendo órdenes de stop loss) y luego vuelve rápidamente; ese es el momento ideal de entrada. La estrategia establece un buffer de 0,6 veces el ATR para asegurarse de que realmente es un "barrido" y no una ruptura real.
⚡ Control de riesgo: la proporción áurea 1:2
Guía para evitar errores: Mucha gente opera como si condujera sin cinturón de seguridad. Esta estrategia exige una relación riesgo-recompensa de 1:2.
- El stop loss se sitúa 0,5 veces el ATR por debajo del nivel clave.
- El take profit está a una distancia 2 veces la del stop loss.
- ¡Incluso con un 40% de aciertos, se obtienen beneficios a largo plazo!
🚀 Consejos prácticos para la aplicación
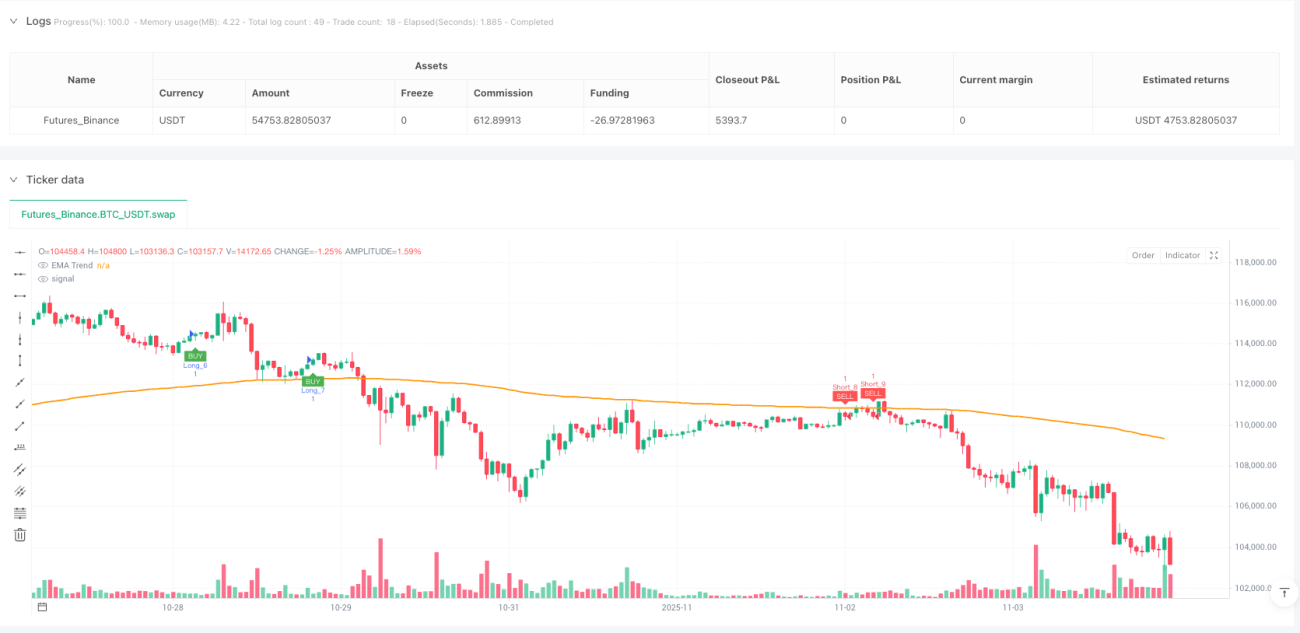
Esta estrategia es ideal para operar en oro en el marco temporal de 15 minutos. ¿Por qué? Porque el mercado del oro tiene buena liquidez, los falsos rompimientos son evidentes y el período de 15 minutos filtra gran parte del ruido.
Recuerda: ¡no seas codicioso! La estrategia te ayuda a encontrar buenas posiciones; el resto déjaselo al mercado y al tiempo~
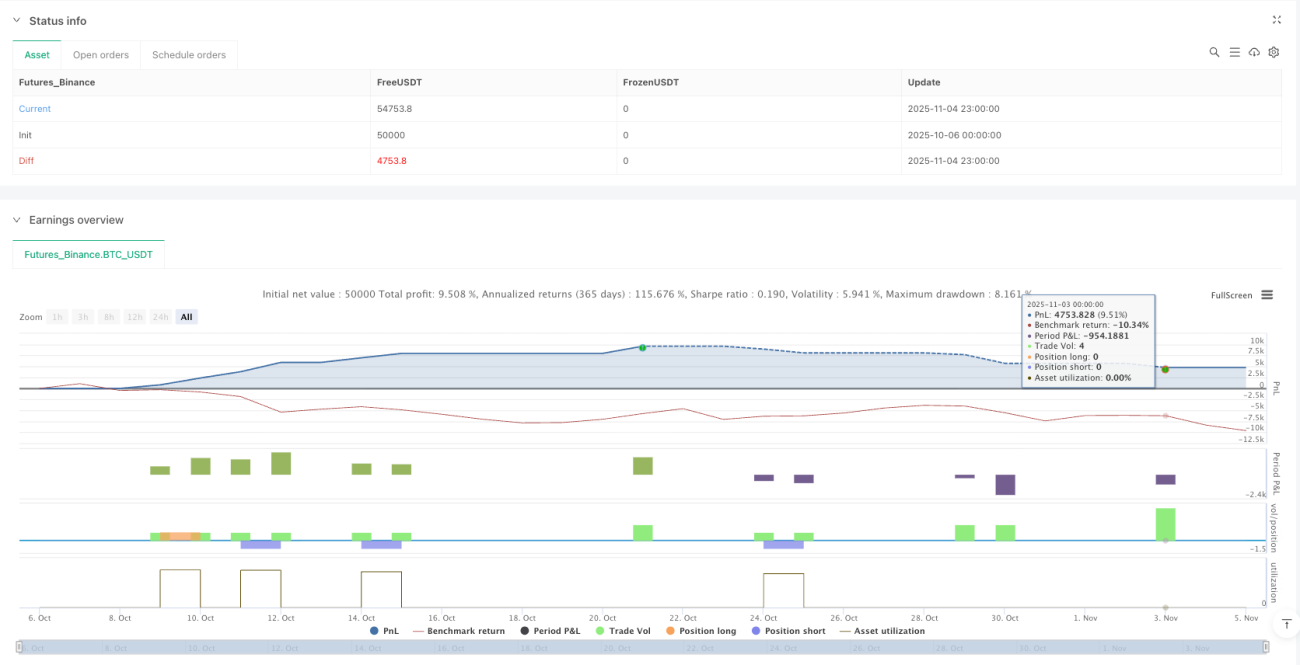
/*backtest
start: 2025-10-06 00:00:00
end: 2025-11-05 00:00:00
period: 1h
basePeriod: 1h
exchanges: [{"eid":"Futures_Binance","currency":"BTC_USDT"}]
*/

//@version=6
strategy("Gold 15m: Trend + S/R + Liquidity Sweep (RR 1:2)", overlay=true, default_qty_type=strategy.fixed, default_qty_value=1, commission_type=strategy.commission.percent, commission_value=0.0)

// ---------------------- INPUTS ----------------------- 1