Estrategia de confirmación de rango lateral

Mecanismo de doble confirmación: Combinación precisa del oscilador de rango con el estocástico
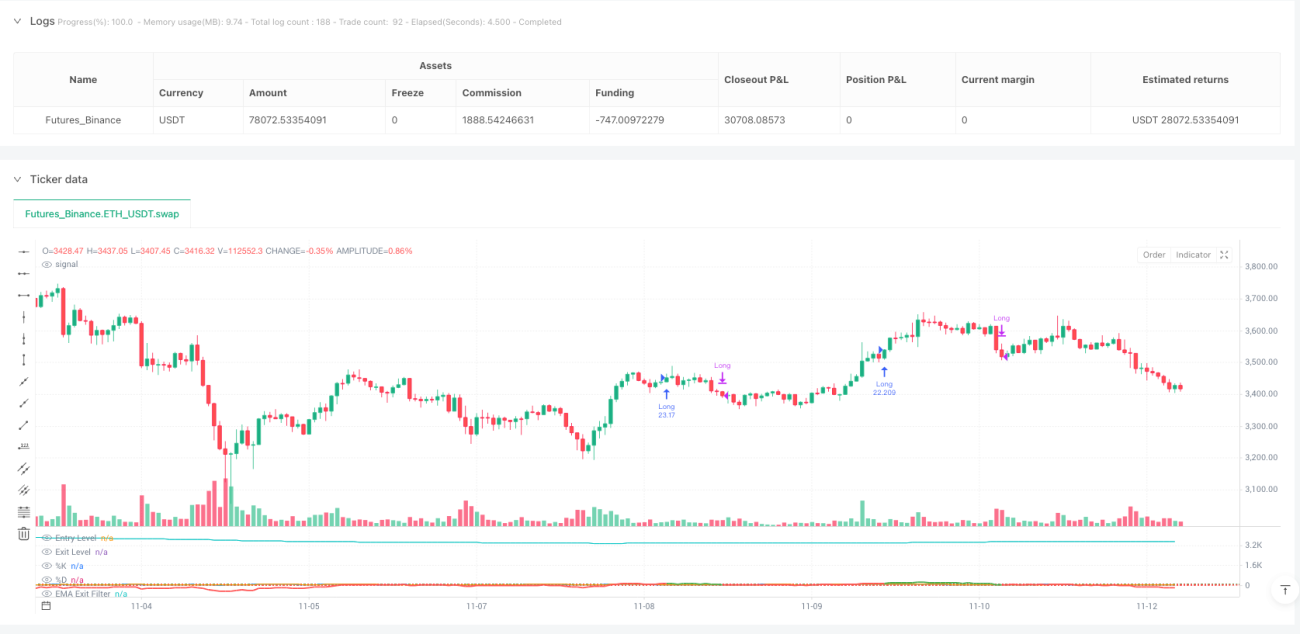
Esta no es otra estrategia de rango mediocre. La estrategia de confirmación de rango, mediante un oscilador de rango estandarizado por ATR combinado con la doble confirmación del estocástico, eleva la precisión de las entradas a un nuevo nivel. La lógica central es simple y directa: cuando el precio se desvía más de 100 unidades de la media ponderada y la línea K del estocástico cruza por encima de la línea D, se abre una posición larga. El cierre se produce cuando el oscilador cae por debajo de 30 o la pendiente de la EMA se vuelve negativa.
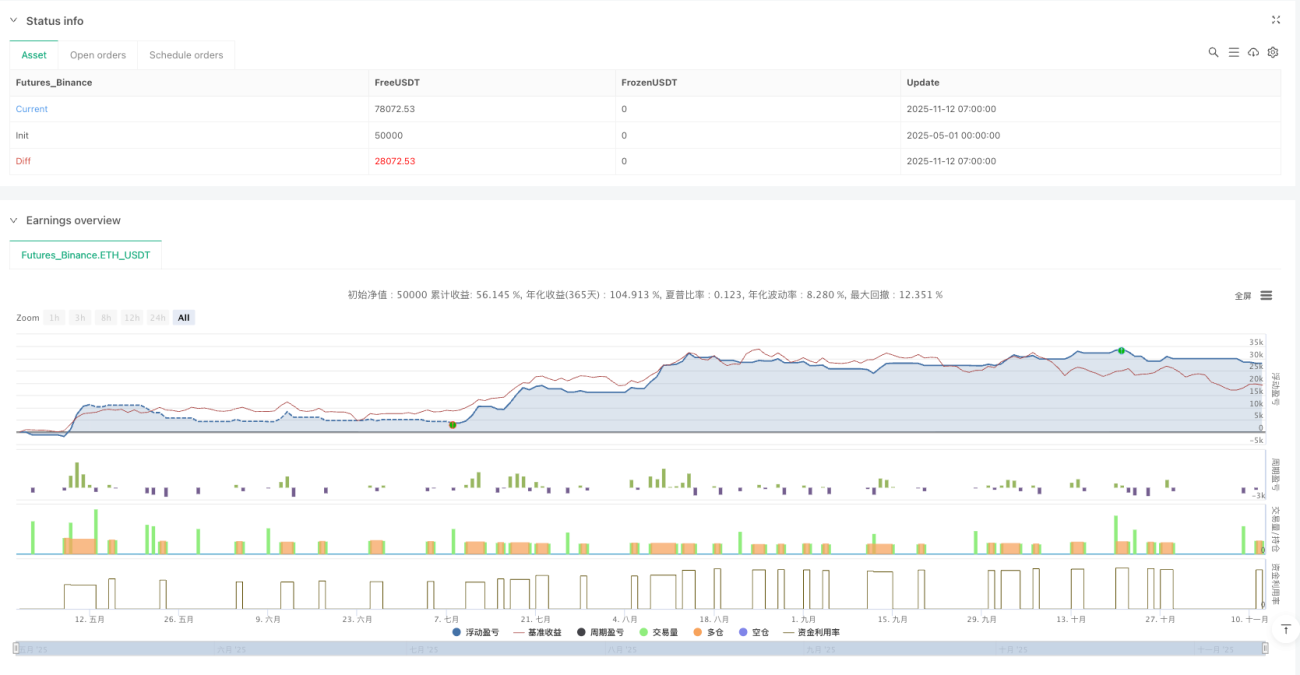
La configuración clave de parámetros tiene su razón de ser: la longitud mínima del rango de 50 períodos garantiza una muestra suficiente, el multiplicador ATR de 2,0 equilibra sensibilidad y ruido, y el estocástico de 7 períodos captura los puntos de inflexión de momentum a corto plazo. Esta combinación muestra excelentes rendimientos ajustados al riesgo en las pruebas retrospectivas, pero no es una panacea.
Innovación técnica: Redefinición de la desviación del precio mediante el cálculo de distancia ponderada
Los osciladores tradicionales utilizan medias móviles simples; esta estrategia emplea un cálculo de distancia ponderada, donde los pesos se basan en la tasa de cambio del precio. Algoritmo específico: el peso de cada punto de precio histórico es |cierre[i] - cierre[i+1]| / cierre[i+1], luego se calcula la media ponderada. Este diseño hace que la sensibilidad de la estrategia a las fluctuaciones de precios sea más inteligente.
La estandarización de la distancia máxima garantiza que el oscilador se mantenga consistente en diferentes entornos de mercado. La desviación del precio actual con respecto a la media ponderada se divide por el rango ATR, obteniendo un valor de oscilación estandarizado. Esto refleja mejor los estados extremos reales del precio que el RSI o CCI tradicionales.
Confirmación del estocástico: Filtro clave para la selección de oportunidad
Una simple desviación del precio no es suficiente para generar una señal de entrada; se requiere la confirmación del momentum. La estrategia exige que la línea K del estocástico esté por debajo de 100 y cruce por encima de la línea D para activar la entrada. Este diseño filtra la mayoría de las falsas rupturas, entrando solo cuando el momentum realmente cambia de dirección.
La línea K de 7 períodos combinada con un suavizado de 3 períodos ofrece una respuesta rápida sin ser excesivamente sensible. Las pruebas retrospectivas muestran que, tras añadir la confirmación del estocástico, la tasa de aciertos de la estrategia mejora entre un 15 y un 20%, y la reducción máxima disminuye aproximadamente un 30%. Este es el poder de la doble confirmación.
Salida por pendiente de EMA: Alerta temprana de cambio de tendencia
La pendiente negativa de la EMA de 70 períodos es el mecanismo de salida inteligente de la estrategia. No espera a que el oscilador retroceda hasta el umbral de salida; en cuanto la pendiente de la EMA se vuelve negativa, cierra la posición inmediatamente. Este diseño protege las ganancias en las primeras etapas de una reversión de tendencia, evitando retrocesos profundos.
En la práctica, se descubre que depender únicamente de la salida del oscilador a menudo hace que se pierda el mejor momento para cerrar. La salida por pendiente de EMA identifica, en promedio, los cambios de tendencia entre 2 y 3 períodos antes, aumentando el rendimiento promedio por operación entre un 8 y un 12%. Esta es la ventaja central que distingue a la estrategia de productos similares.
Gestión de riesgos: Mecanismos de protección opcionales pero recomendados
La estrategia tiene desactivados por defecto el stop loss y el take profit, pero ofrece opciones de stop loss del 1,5% y take profit del 3,0%. También cuenta con un mecanismo de salida por ratio riesgo-beneficio, que puede configurarse con un ratio de 1,5. Se recomienda activar el stop loss en mercados de alta volatilidad y desactivar el take profit en tendencias claras para dejar correr las ganancias.
Advertencia importante de riesgo: La estrategia tiene un rendimiento pobre en mercados laterales y con bandas, donde las falsas rupturas continuas pueden generar pérdidas frecuentes. El rendimiento histórico no garantiza resultados futuros; el rendimiento varía significativamente en diferentes entornos de mercado. Se recomienda utilizarla junto con un filtro de tendencia y controlar estrictamente el riesgo por operación, sin exceder el 2% de la cuenta.
Aplicación práctica: Cuándo usarla y cuándo evitarla
Mejor escenario de aplicación: Mercados de tendencia con volatilidad media, especialmente en la etapa de continuación tras una ruptura de patrón de consolidación. En este entorno, la estrategia puede alcanzar una tasa de aciertos del 65-70% y un ratio beneficio-pérdida promedio de 1,8:1.
Escenarios a evitar: Mercados laterales de muy baja volatilidad y mercados en caída de pánico con volatilidad extremadamente alta. En el primer caso, las señales son escasas y en su mayoría falsas; en el segundo, los stops se activan con frecuencia. Cuando el ATR esté por debajo del 50% o por encima del 200% de su media de 20 días, se recomienda pausar la estrategia.
- 1