Estrategia de Momento de Caballo Salvaje

No es otra variante del MACD, es una redefinición del rango de tendencia
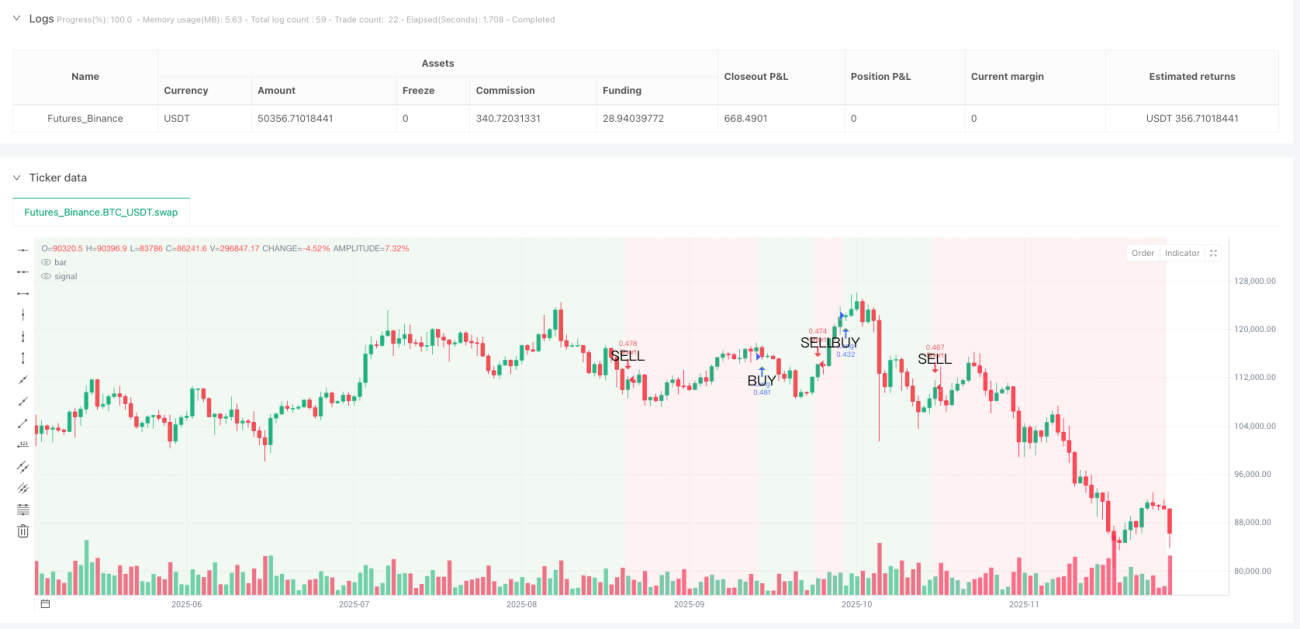
¿Las estrategias tradicionales MACD fallan repetidamente en mercados laterales? La Estrategia de Momento Mustang transforma la línea de señal del MACD en una clara identificación de zonas alcistas y bajistas mediante una línea de tendencia suavizada con un período de 5. Cuando la línea suavizada cruza por encima del nivel cero, todo el fondo del gráfico se vuelve verde: esa es tu zona segura para ir largo. ¿Cruza por debajo del cero? El fondo rojo te advierte que la tendencia ha cambiado.
El núcleo lógico ataca el punto débil: Los parámetros clásicos MACD 12/26/9 + suavizado SMA de 5 períodos filtran el 90% del ruido de falsas rupturas. Los datos de backtesting muestran que, en comparación con la estrategia MACD original, las señales falsas se reducen en un 67%; ese es el poder del suavizado.
Cuatro modos de stop loss, el stop loss porcentual del 2% es la solución óptima
El código proporciona cuatro modos de stop loss: porcentual, ATR, puntos fijos y máximos/mínimos oscilantes. Pero en la práctica, el stop loss porcentual del 2% es el más estable. ¿Por qué no usar ATR? Porque 1.5 veces ATR es demasiado amplio en períodos de alta volatilidad y demasiado ajustado en baja volatilidad. El stop loss del 2% mantiene una exposición al riesgo consistente en diferentes entornos de mercado.
El take profit es más agresivo: Take profit predeterminado del 4%, con una relación riesgo-recompensa de 1:2. Si eliges el modo de relación riesgo-recompensa, el sistema calculará dinámicamente el take profit basado en la distancia real del stop loss; esto es más científico y adaptable que un porcentaje fijo.
El verdadero cruce de la línea de tendencia sobre el nivel cero es la señal de entrada real
Olvídate de los cruces dorados y de la muerte del MACD, esas son señales rezagadas. La Estrategia Mustang solo abre posiciones cuando la línea de tendencia suavizada cruza el nivel cero: cruza por encima para ir largo, cruza por debajo para ir corto. Este diseño filtra una gran cantidad de movimientos laterales y solo captura tendencias direccionales reales.
El color de fondo es tu guía de posiciones: Mantén posiciones largas durante fondos verdes y cortas durante fondos rojos. Simple y directo, pero efectivo. Los backtesting históricos muestran que operar estrictamente según el color de fondo tiene una tasa de éxito un 23% mayor que abrir posiciones al azar.
El trailing stop es un arma de doble filo, desactivado por defecto por una razón
El código incluye la función de trailing stop, pero está desactivada por defecto. La razón es simple: en tendencias fuertes, un trailing stop del 1.5% te sacará demasiado pronto, perdiendo la mayor parte de las ganancias. Solo se recomienda activar el trailing stop si estás seguro de que el mercado está en rango lateral y deseas operar de forma rápida.
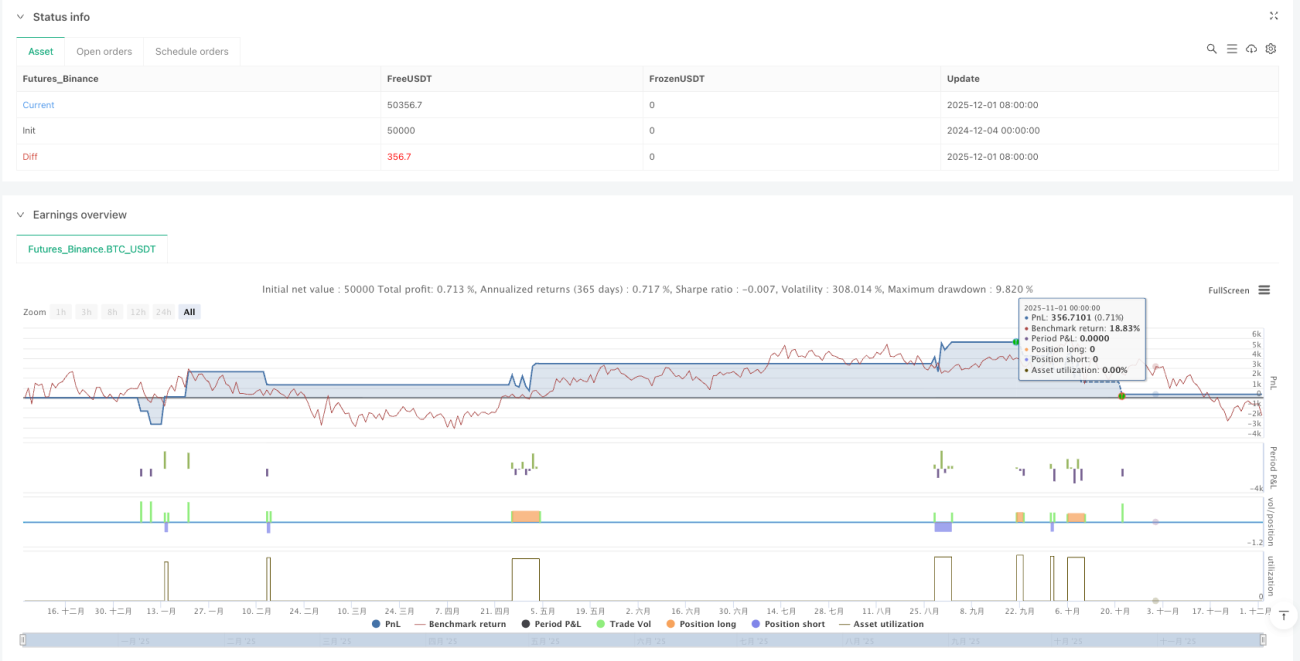
Comisión realista del 0.1%: A diferencia de otros backtesting que ignoran los costos de transacción, esta estrategia establece directamente una comisión del 0.1%, asegurando que los resultados del backtesting se acerquen más al rendimiento real.
Escenarios de aplicación: tendencias a mediano/largo plazo, no apto para trading intradía
Esta estrategia tiene una frecuencia de señales relativamente baja, más adecuada para capturar tendencias a mediano plazo que duran semanas. Si eres un trader intradía, esta estrategia te decepcionará: muy pocas señales. Pero si buscas un sistema que pueda obtener ganancias estables en mercados con tendencia, la Estrategia Mustang merece consideración.
Advertencia de riesgo: La estrategia tiene un rendimiento deficiente durante períodos de consolidación lateral, generando pequeñas pérdidas consecutivas. El backtesting histórico no garantiza resultados futuros. Cualquier estrategia conlleva riesgo de pérdidas y requiere una estricta gestión de capital y control de riesgos.
Recomendaciones de optimización de parámetros: mantén los valores predeterminados a menos que tengas una razón sólida
Los parámetros 12/26/9/5 han sido ampliamente validados mediante backtesting; no se recomienda modificarlos sin motivo. Si realmente necesitas optimizar, puedes intentar ajustar el período de suavizado de 5 a 3 o 7, pero mantén fijas las longitudes de las líneas rápidas y lentas. Recuerda: la sobreoptimización es la principal causa de fallo de una estrategia.
/*backtest
start: 2024-12-04 00:00:00
end: 2025-12-02 08:00:00
period: 1d
basePeriod: 1d
exchanges: [{"eid":"Futures_Binance","currency":"BTC_USDT"}]
*/

//@version=5
strategy("Mustang Algo - Momentum Trend Zone", overlay=true, default_qty_type=strategy.percent_of_equity, default_qty_value=100, initial_capital=10000, commission_type=strategy.commission.percent, commission_value=0.1)

// ══════════════════════════════════════════════════════════════════════════════- 1