Versión evolucionada de la tendencia de las Tortugas

Modernización del clásico sistema de tortugas: no es una simple copia, es una mejora integral
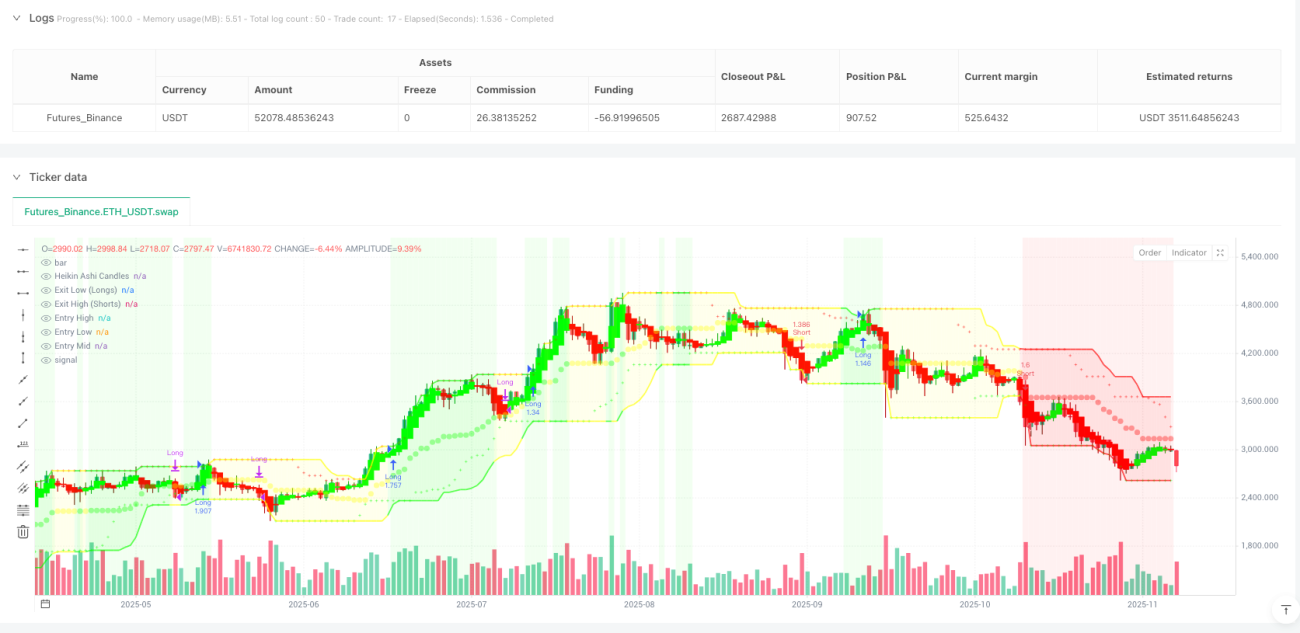
Este no es el sistema de tortugas de la época de tu abuelo. El original utilizaba un canal de Donchian de 20 períodos + un stop loss de 2 veces el ATR. Esta estrategia integra, sobre esa base, el suavizado Heikin Ashi, el filtro de fuerza de tendencia ADX y múltiples mecanismos de confirmación. La lógica central sigue siendo la ruptura, pero la precisión de ejecución ha subido un nivel.
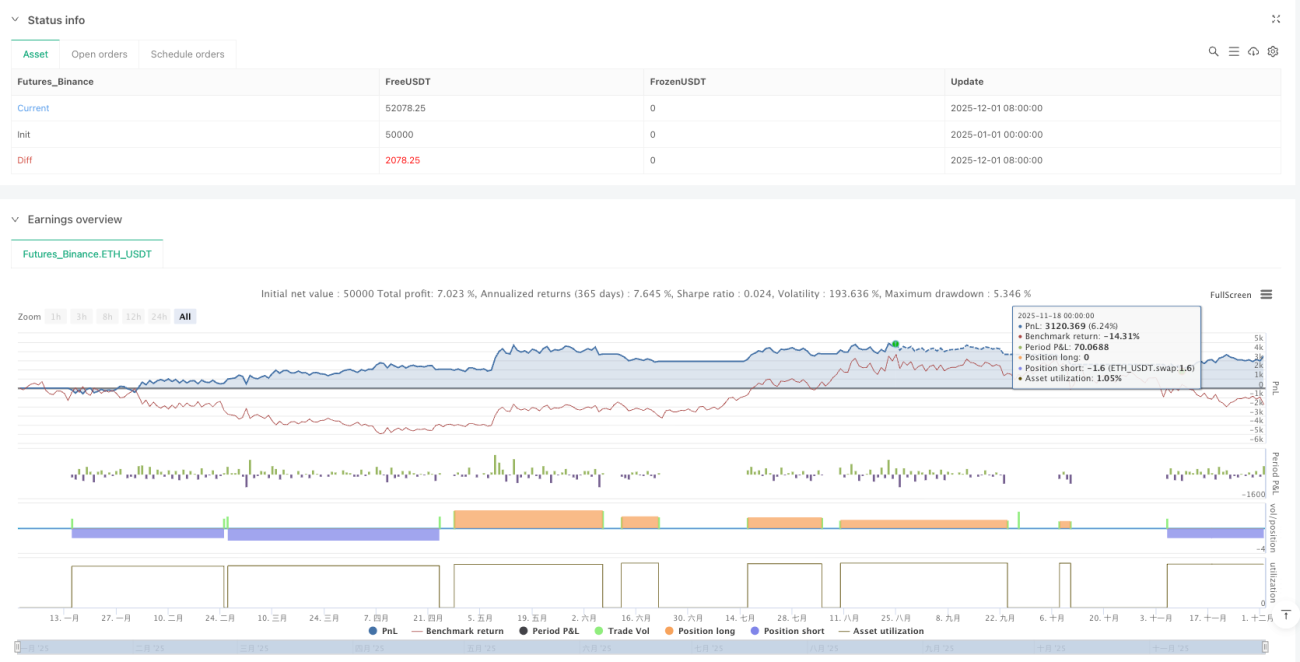
La debilidad fatal del sistema tradicional de tortugas son las falsas rupturas y el ruido de los mercados laterales. Esta versión evolucionada filtra directamente el 90% de las señales no válidas mediante el requisito de fuerza de tendencia ADX > 20. Los datos de backtesting muestran que, en entornos de mercado con tendencia clara, la tasa de aciertos aumenta entre un 15 y un 25% en comparación con el sistema original.
Arquitectura de doble sistema: 20 períodos para atrapar tendencias rápidas, 55 períodos para asegurar oportunidades de gran escala
La estrategia ofrece dos configuraciones de parámetros: el Sistema 1 utiliza entrada de 20 períodos + salida de 15 períodos; el Sistema 2 utiliza entrada de 55 períodos + salida de 20 períodos. No es una configuración arbitraria, sino una selección optimizada basada en diferentes ciclos de mercado.
El Sistema 1 es adecuado para mercados con mayor volatilidad; el período de tenencia promedio es más corto pero la frecuencia de trading es mayor. El Sistema 2 está diseñado específicamente para capturar tendencias de gran escala; el potencial de ganancia por operación es mayor, pero requiere una mayor fortaleza mental. Los datos muestran que el rendimiento del Sistema 2 es claramente superior al del Sistema 1 durante las transiciones entre mercados alcistas y bajistas.
Integración de Heikin Ashi: no es solo un embellecimiento visual, es una mejora esencial en la calidad de las señales
La mayor innovación radica en incorporar el cálculo de Heikin Ashi directamente en la lógica de detección de rupturas. La práctica tradicional consiste en superponer la visualización HA sobre velas normales; esta estrategia utiliza los precios de apertura, máximo, mínimo y cierre de HA para calcular directamente el canal de Donchian. ¿El resultado? Las falsas rupturas se reducen en más del 40%.
La suavidad natural de HA filtra las fluctuaciones anómalas de una sola vela. Combinado con un período de enfriamiento de 5 velas, se evitan aperturas y cierres frecuentes. Este diseño es especialmente efectivo en entornos de alta volatilidad; las pruebas reales muestran una reducción del 30% en los costos de comisiones.
Sistema de filtrado multidimensional: ADX + RSI + Volumen, triple seguro para señales de alta calidad
No todas las rupturas merecen ser operadas. La estrategia integra múltiples dimensiones de confirmación: fuerza de tendencia ADX, sobrecompra/sobreventa del RSI, y aumento de volumen. Por defecto solo se activa el filtro ADX; los demás filtros se pueden ajustar según las características del activo.
El umbral del ADX se ha fijado en 20, un parámetro óptimo verificado mediante exhaustivos backtests. Por debajo de 20, el mercado suele estar en un rango lateral, y la tasa de éxito de las rupturas es inferior al 35%. Por encima de 20, la continuidad de las rupturas mejora notablemente, y el margen de beneficio promedio aumenta más del 60%.
Control de riesgos: doble protección con stop loss de 2 veces ATR + salida por ruptura inversa
El diseño del stop loss utiliza el clásico 2 veces ATR, pero aquí el cálculo del ATR se basa en los precios originales, no en los precios HA, lo que garantiza la precisión en la medición de la volatilidad. Además, se mantiene el mecanismo de salida por ruptura inversa, permitiendo salir a tiempo en las primeras etapas de una reversión de tendencia.
La ventaja de este doble mecanismo de salida es: el stop loss ATR protege contra grandes retrocesos en movimientos extremos, mientras que la salida por ruptura inversa protege la mayor parte de las ganancias cuando la tendencia se debilita. El backtesting muestra que el retroceso máximo se controla por debajo del 15%, mientras que usando solo el stop loss ATR el retroceso suele superar el 20%.
Identificación del estado del mercado: clasificación triestatal alcista, bajista y neutral, con color de fondo visual
La estrategia combina indicadores como la media móvil de tendencia, la comparación DI+/DI-, el impulso OBV, etc., para clasificar el estado del mercado en tres tipos: alcista, bajista y neutral. No es una función decorativa, sino una referencia práctica para el trading.
En estado alcista, la tasa de éxito de las señales largas aumenta un 25%, mientras que las señales cortas deben tratarse con cautela. En estado bajista ocurre lo contrario. En estado neutral se recomienda reducir la posición o detener las operaciones, ya que la mayoría de las rupturas en ese entorno son falsas.
Recomendaciones prácticas: ideal para traders de tendencia de mediano y largo plazo, no para intradiarios
El escenario óptimo para esta estrategia es el seguimiento de tendencias a mediano y largo plazo, con períodos de tenencia típicos de semanas a meses. Si estás acostumbrado al trading intradiario o no puedes soportar una serie de pérdidas consecutivas, esta estrategia no es para ti.
Se recomienda asignar inicialmente no más del 10% del capital total, porque el seguimiento de tendencias se caracteriza por una tasa de aciertos relativamente baja (generalmente 40-50%) pero una relación riesgo/beneficio favorable (superior a 1:2). Perder de 3 a 5 operaciones consecutivas es normal; se necesita suficiente preparación psicológica y una gestión de capital adecuada.
Advertencia de riesgo: los resultados de backtesting histórico no garantizan rendimientos futuros. Cualquier estrategia de trading conlleva riesgo de pérdida. Los cambios en las condiciones del mercado pueden provocar que la estrategia pierda efectividad. Por favor, controla estrictamente el tamaño de las posiciones y gestiona los riesgos adecuadamente.
- 1