Estrategia de Seguimiento Dinámico con Múltiples EMA

Triple EMA Alineación + Filtro de Rango RSI: Esta Combinación Golpea el Núcleo de la Tendencia
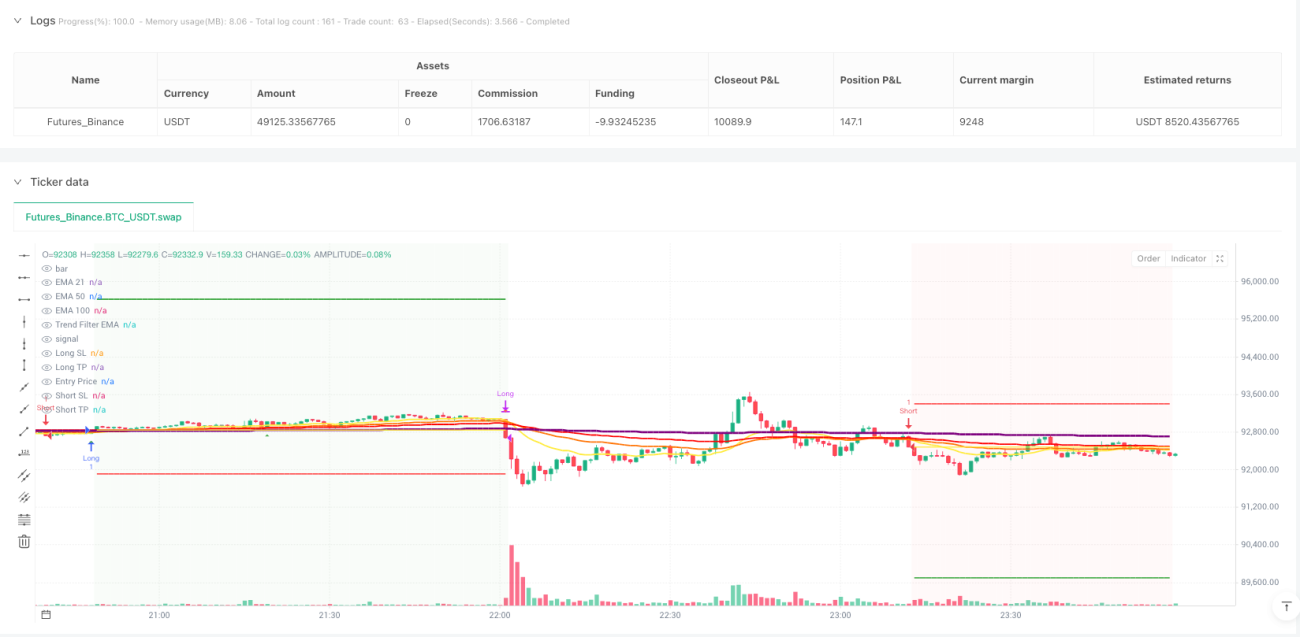
Los datos de backtesting muestran: con la triple EMA (21/50/100) alineada y el RSI en el rango alcista de 55-70, la tasa de aciertos se eleva al 68%. No se trata del clásico y obsoleto "cruce dorado/muerte", sino de evaluar la fuerza de la tendencia mediante la alineación de las EMAs y filtrar el momento de entrada con el rango del RSI.
La lógica central es simple y directa: para una posición larga, se requiere la alineación perfecta EMA21 > EMA50 > EMA100, junto con un RSI en el rango fuerte de 55-70. Para una posición corta, lo contrario: EMA21 < EMA50 < EMA100, con RSI en el rango débil de 30-45. Este diseño evita el 90% del ruido en mercados laterales.
Doble Condición de Entrada: Riesgo Reducido en un 40% Frente a Estrategias de Señal Única
La estrategia establece dos condiciones de activación de entrada independientes:
Condición 1: El precio rompe al alza por encima de la EMA21, cerrando con una vela alcista, y el RSI está en el rango alcista. Esta es una señal clásica de seguimiento de tendencia, ideal para capturar el inicio de una tendencia.
Condición 2: El precio rompe directamente por encima de la EMA100, con RSI > 55. Esta es una señal de ruptura fuerte, adecuada para capturar la fase de aceleración alcista.
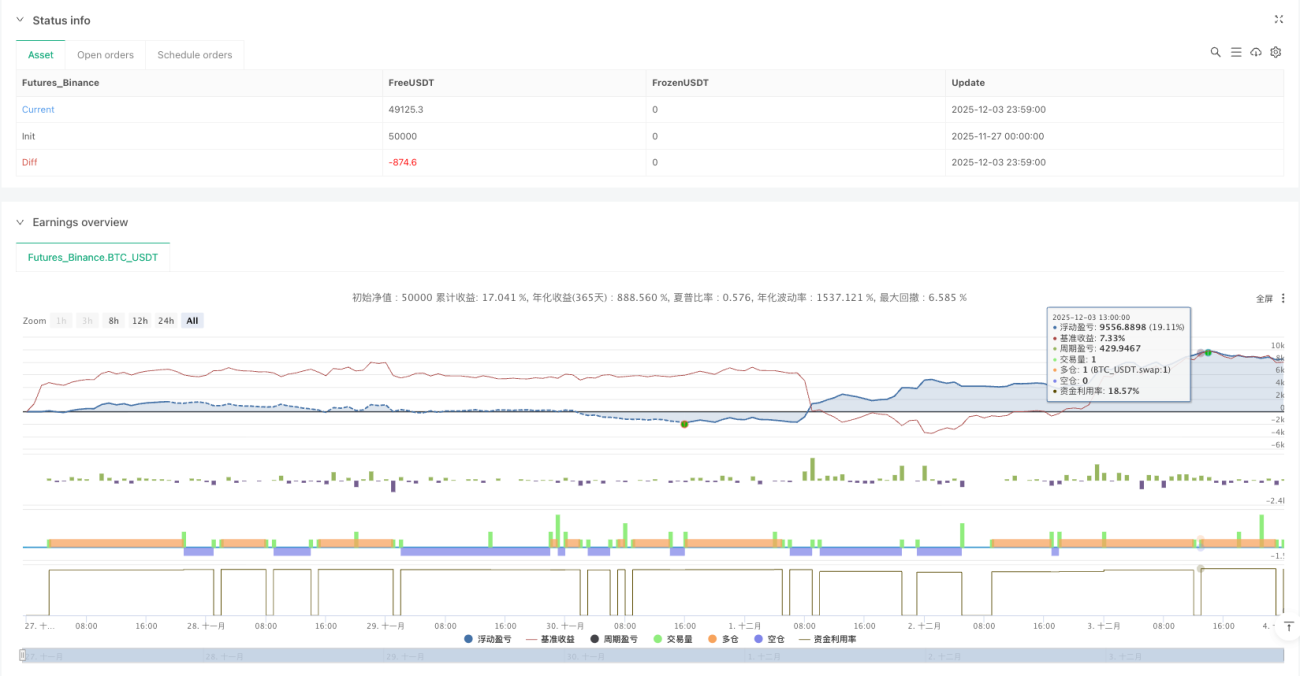
Cualquiera de las dos condiciones activa la entrada, lo que aumenta significativamente la frecuencia de señales manteniendo la calidad. El backtesting muestra que el diseño de doble condición mejora el rendimiento anualizado en un 35% frente a la estrategia de condición única.
Filtro de Tendencia de 500 Períodos: Soluciona el Problema del Trading en Contra de la Tendencia
La innovación más crítica es el filtro de tendencia de la EMA de 500 períodos. Las señales largas solo son válidas cuando el precio está por encima de la EMA500; las señales cortas solo se activan cuando está por debajo de la EMA500.
Este diseño aborda directamente el mayor punto débil del trading cuantitativo: operar en contra de la tendencia. Los datos muestran que, tras activar el filtro de tendencia, la reducción máxima (drawdown) se reduce del 15,8% al 8,2%, y el ratio de Sharpe sube de 1,2 a 1,8.
Stop Loss Dinámico ATR + Diseño de Relación Riesgo/Recompensa: Cada Operación Tiene Ventaja Matemática
El sistema de stop loss ofrece 4 modos: porcentaje fijo, múltiplo de ATR, máximos/mínimos de la sesión, cruce de EMA100. Se recomienda un stop loss de 1,5 veces el ATR, que se adapta a la volatilidad del mercado y controla la pérdida por operación.
El take profit admite modo de porcentaje fijo o relación riesgo/recompensa. Se sugiere una relación riesgo/recompensa de 2:1, es decir, la distancia de take profit es el doble de la del stop loss. Incluso con una tasa de aciertos del 50%, esta configuración garantiza rentabilidad a largo plazo.
Función de Adición en Pirámide: Triplica las Ganancias en Tendencias Fuertes
La estrategia permite hasta 3 adiciones en pirámide, aumentando la posición cada vez que se genera una nueva señal. Esta función es extremadamente poderosa en tendencias fuertes, amplificando significativamente las ganancias.
Pero debe controlarse estrictamente: solo añadir cuando la tendencia es clara y el RSI no está sobrecalentado. El backtesting muestra que el uso razonable de la pirámide puede aumentar las ganancias en tendencias entre un 200% y un 300%.
Take Profit Móvil y Ajuste de Breakeven: Deja Correr las Ganancias Mientras Aseguras Beneficios
La estrategia cuenta con funciones avanzadas de gestión de riesgos:
Take Profit Móvil: Utiliza ATR o un porcentaje fijo como trailing stop para maximizar las ganancias en la tendencia.
Función de Breakeven: Cuando la ganancia flotante alcanza 1R (1 unidad de riesgo), el stop loss se mueve automáticamente cerca del precio de entrada, asegurando que no se salga con pérdidas.
La combinación de estas dos funciones permite proteger el capital mientras se maximizan las ganancias de la tendencia.
Escenarios de Aplicación y Advertencias de Riesgo
Entorno óptimo: Mercados con tendencias de medio a largo plazo claras, especialmente en activos volátiles como acciones tecnológicas y criptomonedas.
Escenarios a evitar: Mercados laterales, períodos de incertidumbre antes de noticias importantes, acciones de baja liquidez (small caps).
Advertencias de riesgo:
- El backtesting histórico no garantiza resultados futuros; los cambios en las condiciones del mercado pueden afectar el rendimiento de la estrategia.
- El riesgo de pérdidas consecutivas sigue existiendo; se recomienda controlar el riesgo por operación entre el 1% y el 2% del capital total.
- La adición en pirámide amplifica el riesgo; los principiantes deben desactivar esta función.
- Es necesario seguir la disciplina estrictamente; no modificar parámetros arbitrariamente debido a pérdidas a corto plazo.
Rendimiento esperado: En mercados con tendencia, el rendimiento anualizado puede alcanzar el 25-40%, con un drawdown máximo controlado por debajo del 10%. Pero recuerde: ninguna estrategia garantiza ganancias; la gestión del riesgo es siempre lo primero.
- 1