Stratégie de trading multi-périodes basée sur le RSI et les moyennes mobiles

Aperçu
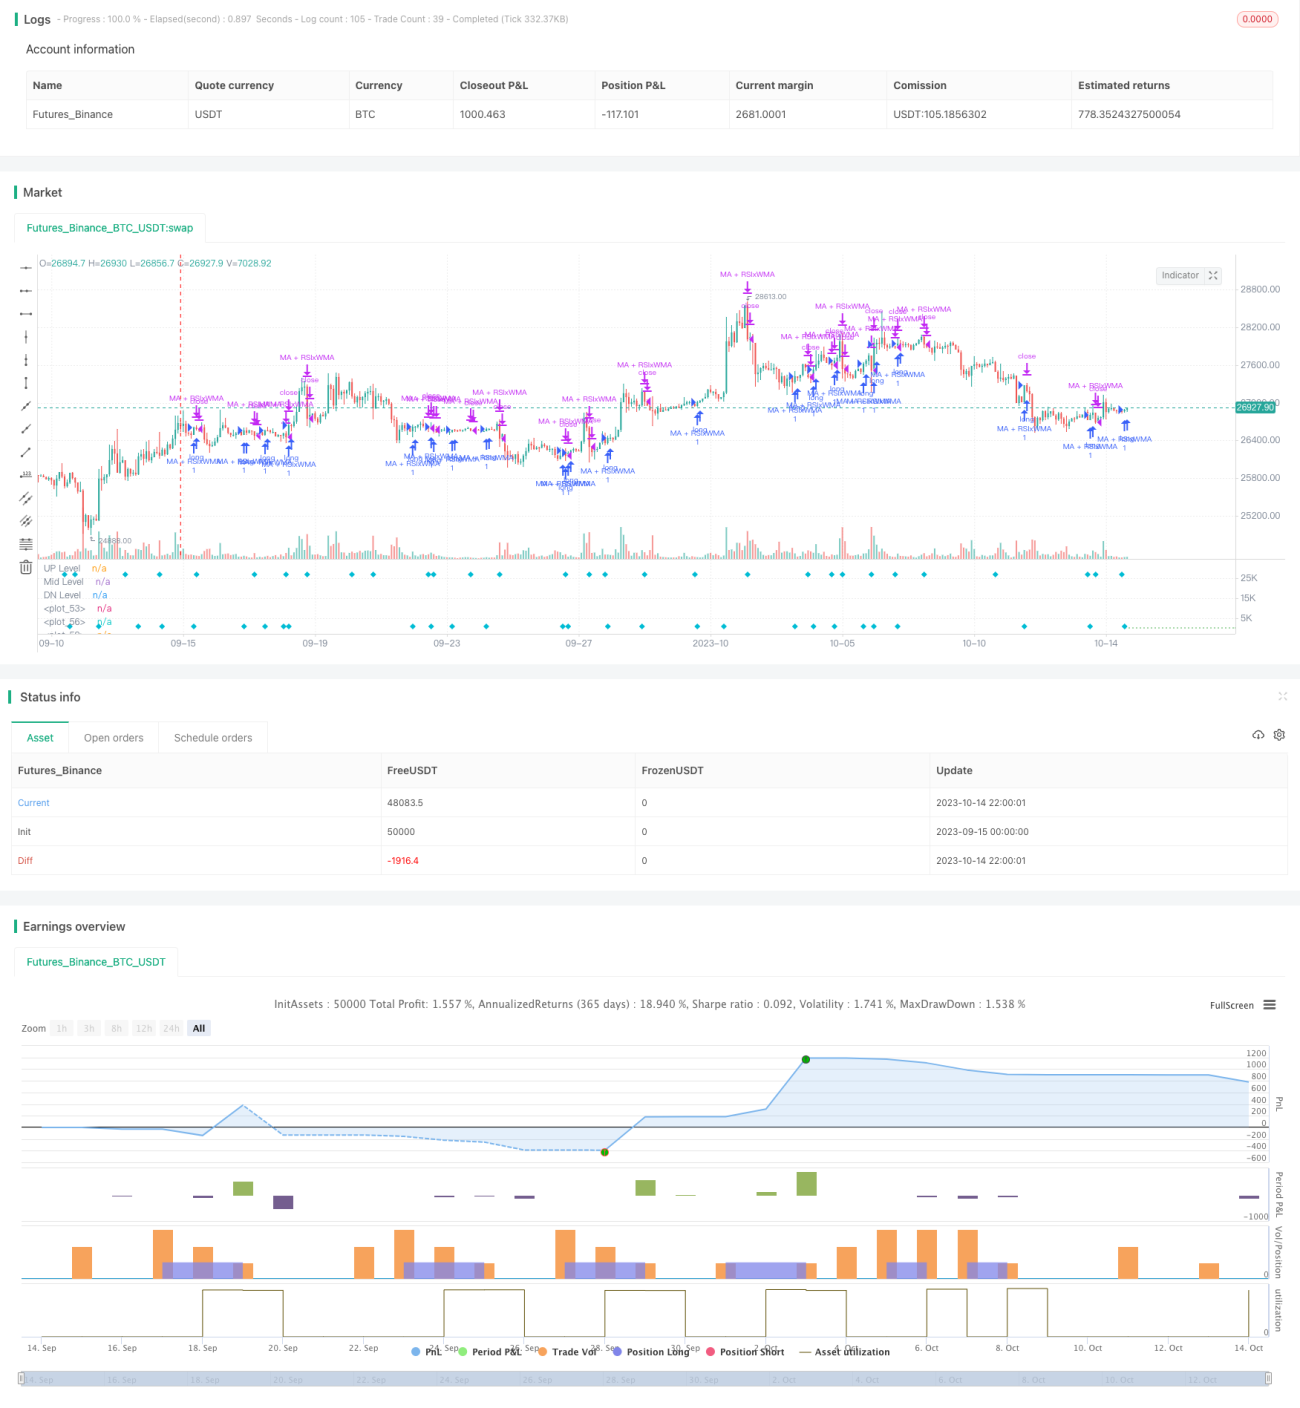
L'idée centrale de cette stratégie est d'utiliser à la fois l'indice relativement faible (RSI) et les moyennes mobiles de différentes périodes de temps pour identifier les points de retournement de tendance afin de capturer les tendances des lignes moyennes et longues tout en effectuant des transactions courtes. La stratégie intègre plusieurs signaux de trading et vise à améliorer le taux de réussite des transactions.
Principe de stratégie
- Calculer l'indicateur RSI, ainsi que les moyennes mobiles EMA et WMA
- Lorsque la ligne de l'indicateur RSI dépasse la moyenne mobile WMA, un signal d'achat/vente est généré.
- Lorsque la ligne rapide de l'EMA dépasse la ligne lente de la WMA, un signal d'achat/vente est généré.
- Lorsque le RSI et l'EMA dépassent simultanément le WMA, un fort signal d'achat/vente est généré.
- En outre, le signal principal peut être renforcé lorsque le prix dépasse la moyenne mobile assistée.
- Réglez les conditions de stop-loss et de stop-stop.
La stratégie intègre des signaux de rupture de plusieurs indicateurs techniques, des moyennes mobiles avec différents paramètres pour identifier les tendances de différents cycles, ce qui améliore la fiabilité de la stratégie. L'indicateur RSI détermine le statut de surachat, l'EMA détermine la tendance à court terme, la WMA détermine la tendance à moyen terme, la tendance de vérification de rupture des prix et des moyennes auxiliaires.
Analyse des avantages
- Le RSI est un indicateur de rétrogradation qui permet de saisir les opportunités de rétrogradation dans les zones de sur-achat et de survente.
- Les moyennes mobiles sont utilisées comme filtres de tendance pour éviter les fausses ruptures.
- La combinaison de plusieurs périodes permet de suivre à la fois les tendances à long terme et les opportunités à court terme.
- La combinaison de plusieurs signaux d'indicateurs peut améliorer le taux de réussite des transactions.
- Il est possible de mettre en place des stratégies de stop loss et de contrôler les risques.
Analyse des risques
- L'indicateur RSI est sujet à de faux signaux et nécessite un filtrage des moyennes mobiles.
- Un rebond sous une tendance à grande périodicité peut déclencher un signal de revers et doit être traité avec prudence.
- Optimiser les paramètres tels que la longueur des cycles RSI, les cycles des moyennes mobiles, etc.
- Les paramètres de points de rupture doivent être utilisés avec précaution pour éviter d'être piégés.
Le risque peut être atténué par des méthodes telles que l'optimisation des paramètres, des stratégies d'arrêt de perte rigoureuses et la prise en compte des tendances à grande échelle.
Direction d'optimisation
- Optimiser les paramètres RSI pour trouver la meilleure longueur de cycle
- Tester différents types de combinaisons de moyennes mobiles
- Ajout d'indicateurs de volatilité tels que l'ATR, l'arrêt de la perte d'ajustement dynamique.
- Ajout d'un module de gestion du volume des transactions.
- L'optimisation des paramètres et l'évaluation de la qualité du signal sont effectuées à l'aide de techniques d'apprentissage automatique.
Résumer
Cette stratégie intègre le suivi des tendances et la rétrogradation des points, l'analyse de plusieurs périodes et l'utilisation intégrée de plusieurs indicateurs, dans le but d'améliorer la réussite des transactions. La clé est de bien contrôler les risques, d'optimiser les paramètres et de prendre en compte l'impact des tendances macro-cycliques sur les transactions.
- 1