Stratégie de cassure de fuite

Aperçu
Cette stratégie utilise principalement l'indicateur de la courbe des canaux de Changchun pour réaliser une stratégie de négociation de rupture de type suivi. Cette stratégie combine deux stratégies de négociation de tendance et de rupture, en recherchant des entrées à des points de rupture de plus courte durée sur la base du jugement de la tendance de la ligne longue, pour réaliser des transactions en cours de tendance.
Principe de stratégie
-
Paramètres de l'indicateur du canal de Yangtze, cycle par défaut 20;
-
Réglez l'EMA sur une moyenne mobile lisse, avec 200 cycles par défaut;
-
Par défaut, le ratio risque/revenu est de 1,5;
-
les paramètres de dépassement et de reprise de la marche sont réglés sur des têtes multiples et sur des têtes vides;
-
Le résultat de cette analyse est le résultat de l'analyse de l'impact de la rupture.
-
Signal multiple: génère un signal multiple si la précédente rupture est basse et que le prix est supérieur à la ligne supérieure de Dongguan et au-dessus de la ligne moyenne de l'EMA;
-
Signal de tête creuse: génère un signal de tête creuse si la rupture précédente est haute et que le prix est en dessous de la trajectoire descendante de Dongguan et en dessous de la moyenne de l'EMA;
-
Après avoir entré dans une position à plusieurs têtes, le stop-loss est réglé sur le retrait de 5 points de la voie de descente de Dongjian, le stop-loss est le rapport risque-bénéfice multiplié par la distance de stop-loss;
-
Après avoir entré dans la position vide, le stop loss est réglé sur le retrait de 5 points sur le rail de Dongjian, et le stop stop est le rapport risque-bénéfice multiplié par la distance de stop loss.
De cette façon, la stratégie, combinée à un jugement de tendance et à des opérations de rupture, peut saisir les opportunités de courte période dans les tendances de longue ligne. En même temps, le paramètre de stop-loss peut contrôler les risques et les gains d'une seule transaction.
Analyse des avantages
-
Suivez la tendance à long terme et évitez les transactions à contre-courant
-
Le canal de Dongxian est utilisé comme indicateur de ligne longue et, en combinaison avec le filtre homogène de l'EMA, permet de mieux juger de la direction de la tendance.
-
Les mécanismes de prévention des pertes contrôlent chaque risque et limitent les pertes possibles.
-
L'optimisation du ratio risque/bénéfice permet d'augmenter le ratio profit/perte et de rechercher des gains supplémentaires.
-
Les paramètres de la rétroaction sont réglés de manière flexible, permettant d'ajuster la meilleure combinaison de paramètres pour différents marchés.
Analyse des risques
-
Le canal de Dongxian et la ligne d'uniformité EMA sont utilisés comme indicateurs de filtrage, ce qui peut donner un mauvais signal.
-
Les transactions de rupture sont faciles à piéger et nécessitent une identification claire du contexte de la tendance.
-
Le stop loss est une distance fixe qui ne peut pas être ajustée en fonction de la volatilité du marché.
-
Paramètres L'espace d'optimisation est limité et les performances du disque dur sont difficiles à garantir.
-
Le système de trading n'a pas résisté à l'épreuve d'un trop grand nombre d'événements aléatoires, et les événements de Black Swans peuvent avoir entraîné des pertes considérables.
Direction d'optimisation
-
Il est possible d'envisager d'ajouter d'autres indicateurs pour filtrer, tels que l'indicateur de vibration, pour améliorer la qualité du signal.
-
Il est possible de définir un Stop Loss Intelligent qui permet d'ajuster la position de perte en fonction de la volatilité du marché et de la dynamique de l'indicateur ATR.
-
Des méthodes telles que l'apprentissage automatique peuvent être utilisées pour tester et optimiser les paramètres afin de les rendre plus proches du marché réel.
-
L'optimisation de la logique d'entrée peut être effectuée en réglant le VOLUME ou l'indicateur de volatilité comme condition auxiliaire pour éviter les pièges.
-
Il est possible d'envisager une combinaison avec des stratégies de suivi de tendances ou d'apprentissage automatique pour former une stratégie hybride et améliorer la stabilité.
Résumer
Cette stratégie est une stratégie de rupture de type tracking, dont l'idée centrale est de déterminer la tendance de la ligne longue, d'effectuer une opération de rupture en tant que signal et de définir un arrêt de perte pour contrôler le risque de transaction unique. Cette stratégie présente certains avantages, mais il existe également une certaine marge d'optimisation.
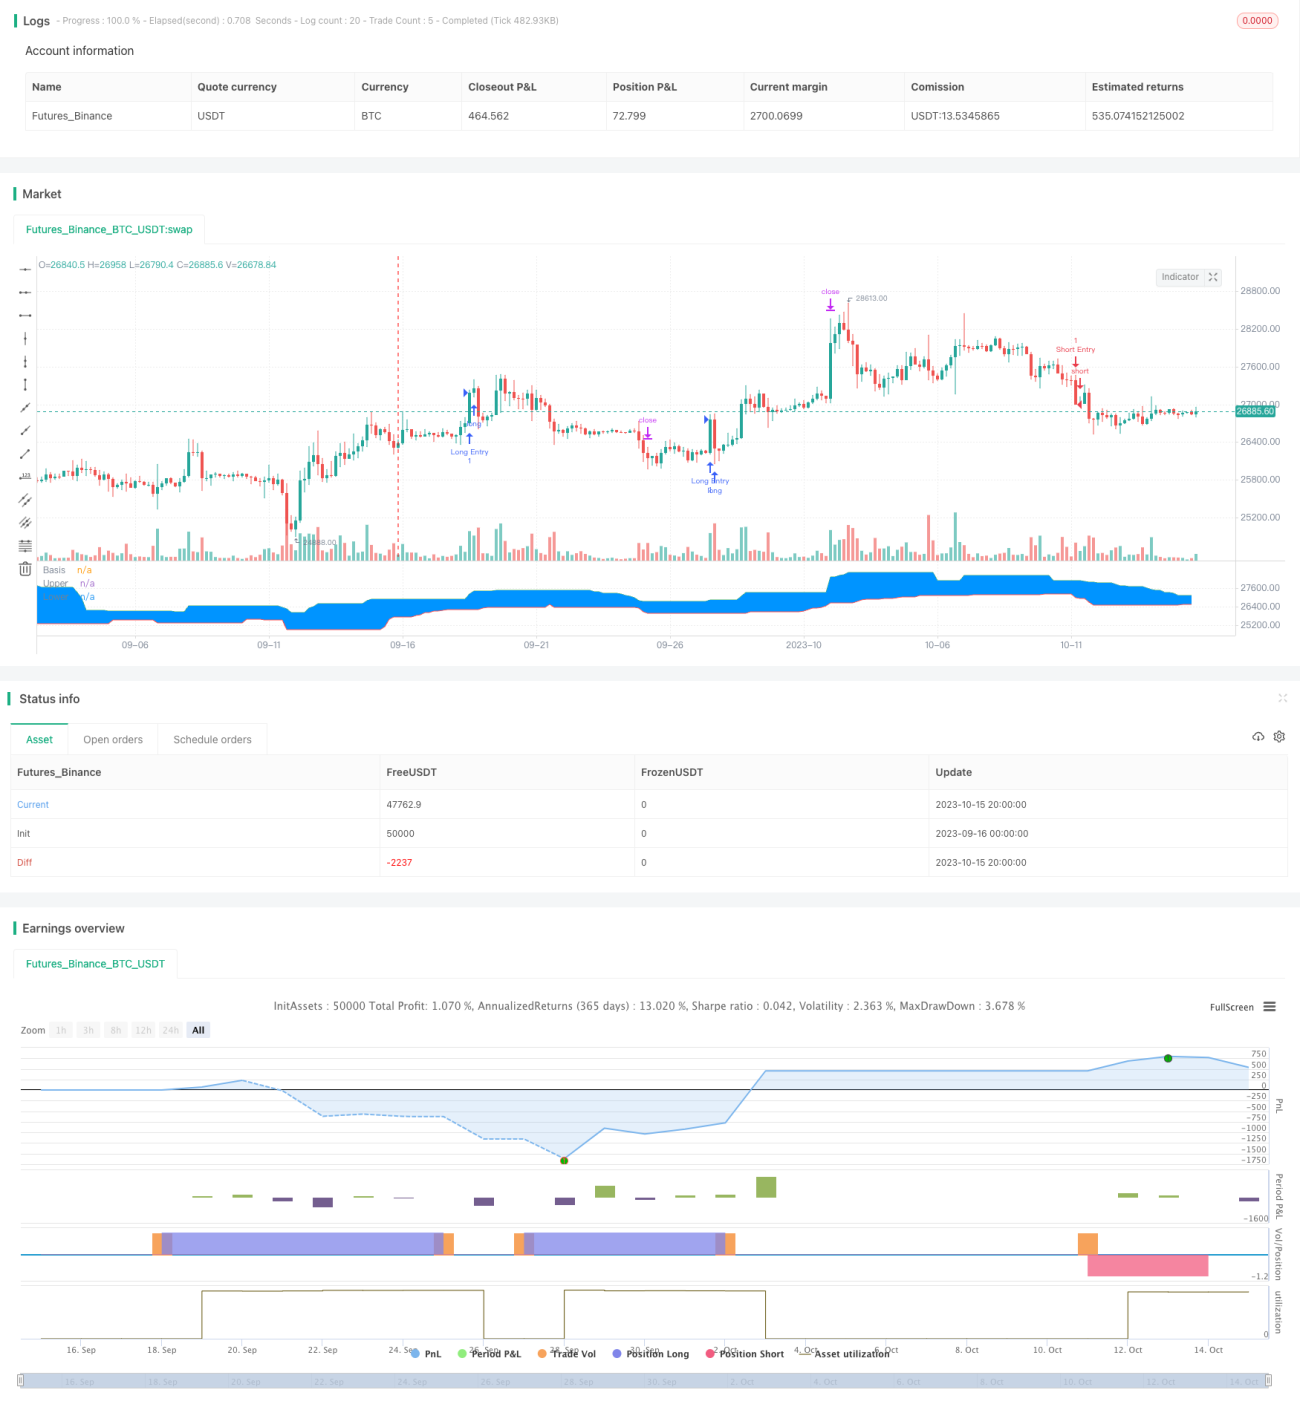
/*backtest
start: 2023-09-16 00:00:00
end: 2023-10-16 00:00:00
period: 4h
basePeriod: 15m
exchanges: [{"eid":"Futures_Binance","currency":"BTC_USDT"}]
*/

//@version=4
// Welcome to my second script on Tradingview with Pinescript
// First of, I'm sorry for the amount of comments on this script, this script was a challenge for me, fun one for sure, but I wanted to thoroughly go through every step before making the script public
// Glad I did so because I fixed some weird things and I ended up forgetting to add the EMA into the equation so our entry signals were a mess- 1