Stratégie de croisement de moyenne mobile

Aperçu
Cette stratégie utilise plusieurs indicateurs techniques, tels que les moyennes mobiles et les indicateurs de choc, combinés à des formes de traversée de la ligne moyenne, pour identifier les tendances des prix des actions et les points de basculement et de basculement, pour effectuer des opérations d'achat et de vente.
Le principe
La stratégie est principalement composée des éléments suivants:
-
Sélectionnez la plage: définissez le nombre de minutes dans la plage de temps du diagramme K, par exemple 1 minute, 5 minutes, etc.
-
Sélectionnez une moyenne mobile: configurez les paramètres des moyennes mobiles courantes telles que les EMA, les SMA, les lignes de 10 jours, les lignes de 20 jours, etc.
-
Sélectionnez l'indicateur de choc: paramètres de l'indicateur de choc tels que le RSI, le MACD, l'indicateur William.
-
Calculer les signaux d'achat et de vente: en utilisant des fonctions personnalisées, calculer les valeurs des moyennes mobiles et de l'indicateur de volatilité. Un signal d'achat est généré lorsque la moyenne à court terme est traversée par la moyenne à long terme; un signal de vente est généré lorsque la moyenne à court terme est traversée par la moyenne à long terme.
-
Système de notation: les signaux d'achat et de vente de chaque indicateur sont notés numériquement, puis la moyenne est obtenue pour l'indice de notation global. L'indice de notation est supérieur à 0 pour les signaux d'achat et inférieur à 0 pour les signaux de vente.
-
Signal de transaction: génère un signal de transaction final en fonction de l'indice de notation supérieur ou inférieur à 0, pour effectuer une opération d'achat ou de vente.
La stratégie utilise plusieurs indicateurs en combinaison, permettant d'identifier efficacement les tendances des prix et les points de basculement, renforçant ainsi la fiabilité du signal. La traversée de la ligne uniforme est un signal technique de tendance efficace, combiné à un indicateur de choc qui aide à éviter les fausses ruptures. Le système de notation rend également les signaux de négociation plus clairs.
Les avantages
- Combiné à une traversée uniforme et à une variété d'indicateurs de choc, le signal de transaction est plus fiable et évite les faux signaux
- Le système de notation rend les signaux d'achat et de vente plus clairs
- Une programmation modulaire avec des fonctions personnalisées, une structure claire du code
- Une analyse de composition en utilisant plusieurs périodes de temps pour une plus grande précision
- Optimisation des paramètres tels que la longueur du RSI, la période de la moyenne rapide et lente du MACD, etc.
- Flexibilité accrue grâce à des paramètres de configuration personnalisables pour les indicateurs et les paramètres de ligne moyenne
Les risques
- La tendance boursière est différente pour les actions suivantes
- La fréquence des transactions pourrait être plus élevée, augmentant les coûts de transaction et le risque de glissement
- Les paramètres d'optimisation doivent être testés à plusieurs reprises pour s'adapter aux différentes caractéristiques des actions
- Il existe un certain risque de retrait et de perte.
Les risques peuvent être atténués par les moyens suivants:
- Choix d'actions en fonction du marché boursier
- Adaptation appropriée des délais de détention et réduction de la fréquence des transactions
- Optimisation des paramètres pour les rendre plus adaptés aux caractéristiques de chaque action
- Une stratégie de stop-loss pour contrôler les pertes
Direction d'optimisation
Cette stratégie peut être optimisée dans les domaines suivants:
- Ajout d'autres indicateurs, tels que les indicateurs de volatilité et les signaux de renforcement
- Paramètres d'optimisation automatique combinés à une méthode d'apprentissage automatique
- Ajout de modules de sélection de titres et de secteurs
- Une approche combinée à la sélection quantitative
- Les méthodes d'arrêt de la perte d'adaptation et de suivi
- Considérer le marché et éviter l'incertitude
- Analyser les résultats des transactions sur le marché réel et ajuster le poids de notation
En résumé, la stratégie intègre la rupture de la ligne moyenne et plusieurs indicateurs, permettant d'identifier efficacement les mouvements de prix. Cependant, il faut constamment tester l'optimisation et contrôler les risques.
Résumer
Cette stratégie utilise le passage de la ligne de parité comme signal de négociation principal, avec confirmation par divers indicateurs de choc, et utilise un système de notation pour produire un signal d'achat et de vente clair. Elle permet d'identifier efficacement les tendances des prix et les points de basculement, mais nécessite un contrôle de la fréquence des transactions, une réduction des coûts et des risques de négociation, ainsi que des paramètres d'optimisation continue.
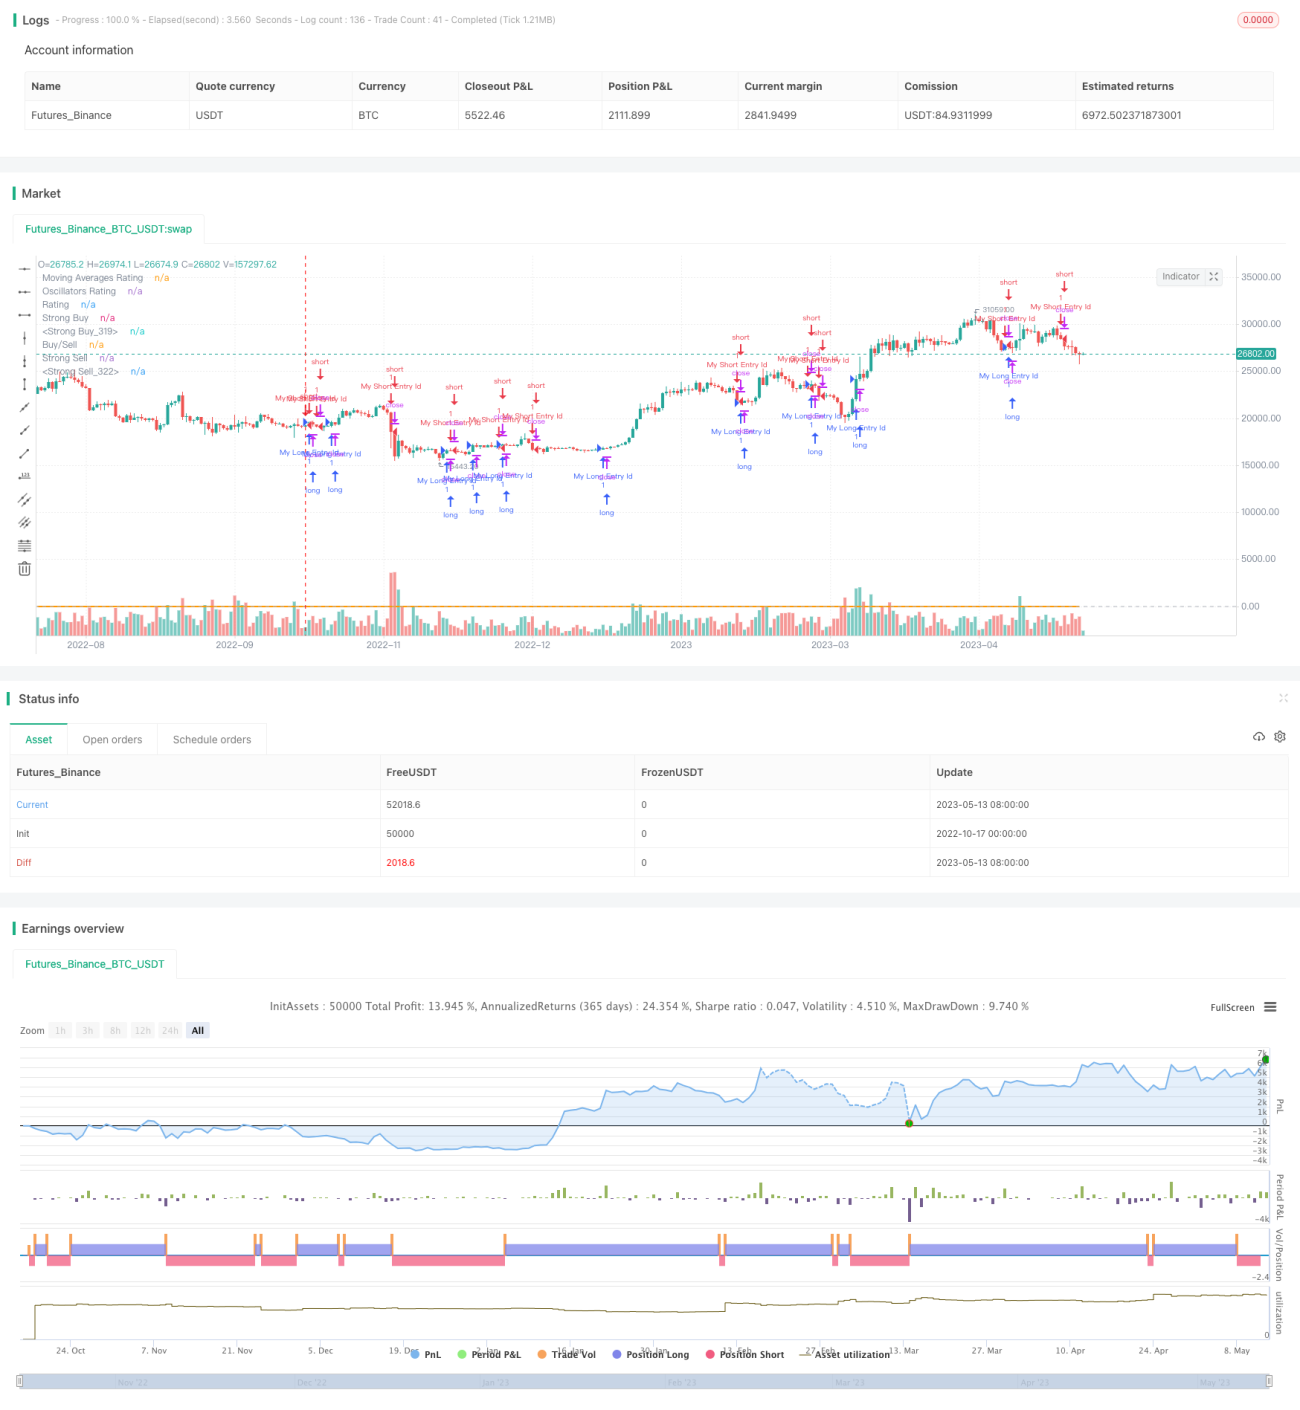
/*backtest
start: 2022-10-17 00:00:00
end: 2023-05-14 00:00:00
period: 1d
basePeriod: 1h
exchanges: [{"eid":"Futures_Binance","currency":"BTC_USDT"}]
*/

//@version=4
strategy("TV Signal", overlay=true, initial_capital = 500, currency = "USD")

// -------------------------------------- GLOBAL SELECTION --------------------------------------------- //- 1