
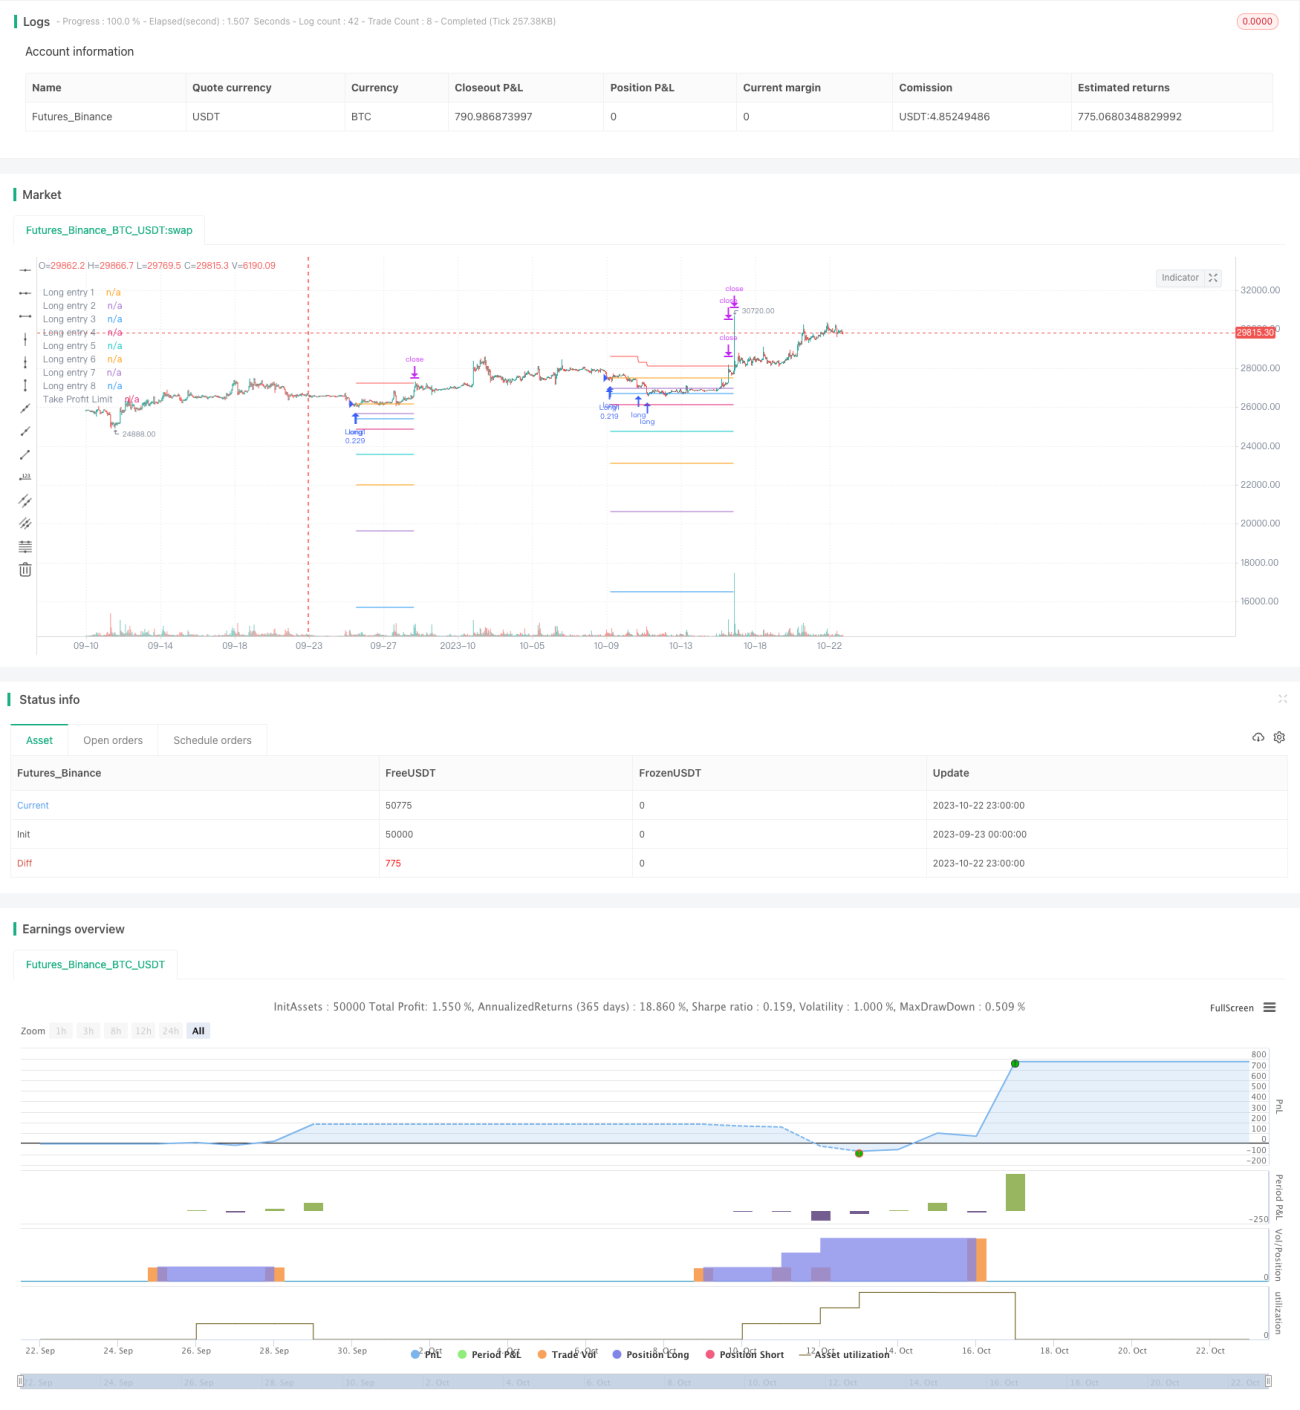
La stratégie utilise la combinaison de l’indicateur RSI et de la moyenne des prix pour rechercher des opportunités de survente et de positionner davantage lorsque le cours de l’action est inférieur à la moyenne. La stratégie augmente progressivement les positions en fonction du pourcentage prédéfini pour atteindre le coût moyen de la position.
Lorsque l’indicateur RSI est inférieur à la ligne de survente 29 et que le prix de clôture est inférieur à la ligne moyenne, ouvrez un premier ordre supplémentaire.
Il y a une augmentation de la position lorsque le cours de l’action atteint 2% de la première baisse; une augmentation de la position pour la troisième fois lorsque la baisse atteint 3%, et ainsi de suite jusqu’à un maximum de 8 augmentations de la position. Cela permet d’obtenir l’effet de la construction de la position par lots.
Chaque fois qu’une position est ouverte, le prix d’ouverture est noté. Ces points de prix sont les prix de référence pour l’entrée. Les lignes de prix sont tracées sur le graphique.
Après avoir ouvert une position, le prix moyen de la position est calculé. Le prix de clôture de chaque position est de 3% du prix moyen et le prix de clôture de la position dans son ensemble est de 4%.
Lorsque la hausse des prix dépasse le prix d’arrêt d’une position, le placement de la position est sélectionné.
La méthode de calcul de l’arrêt progressif: chaque fois qu’une position est levée, le profit réalisé par cette position est déduit du prix d’arrêt global. Cela permet à la ligne d’arrêt de descendre lentement et de s’arrêter complètement seulement lorsque les bénéfices de toutes les positions suffisent à compenser la perte maximale.
Lorsque le prix déclenche une pause progressive, sélectionnez le placement complet.
L’indicateur RSI permet de détecter plus précisément les zones de survente et de saisir les opportunités de reprise.
Il est possible d’augmenter le coût moyen d’une position en plusieurs lots.
La suspension progressive permet de réduire le risque de pertes et de réaliser une sortie progressive. Même les pertes peuvent être contrôlées dans une certaine mesure.
Le taux de coupe et le taux de prise de position sont configurables et peuvent être adaptés au risque stratégique du marché.
Les lignes de référence d’ouverture et de fermeture des positions sont représentées sur le graphique, ce qui permet de juger de la répartition des positions.
En cas de choc, il est possible de déclencher plusieurs ouvertures et arrêts de position, les transactions entraînant fréquemment des pertes de points de glissement. Les paramètres RSI peuvent être assouplis de manière appropriée, ce qui réduit le nombre de transactions.
Le nombre et le ratio de placements incorrects peuvent conduire à des transactions excessives et doivent être configurés avec prudence en fonction de la situation financière.
Si le marché continue à baisser, il est possible de risquer une prise de position sans fond. Il faut prévoir une limite maximale au nombre de prises de position, et le dernier niveau de prise de position doit être conservateur.
Si le ratio d’arrêt est trop petit, il peut entraîner un arrêt prématuré. Le rapport d’arrêt approprié doit être défini en fonction des données de rétroaction historique.
Les signaux RSI peuvent être filtrés par des indicateurs tels que le MACD, ce qui réduit les transactions invalides.
Il est possible d’arrêter les pertes en fonction de l’ATR pour éviter les pertes massives causées par des situations extrêmes.
On peut optimiser les paramètres tels que le nombre de prises de position, le ratio, le taux de rupture, etc. pour adapter les stratégies aux différentes variétés.
Le ratio de freinage peut être ajusté intelligemment en fonction du taux d’oscillation, avec un assouplissement approprié en cas de forte oscillation.
Cette stratégie utilise l’indicateur RSI pour déterminer les zones de survente et effectuer des transactions de revers en fonction de la ligne de parité des prix. Elle utilise également un mécanisme d’hypothèque intelligent et un arrêt progressif pour réaliser des stratégies de multiplication efficaces dans le cadre d’un contrôle du risque.
/*backtest
start: 2023-09-23 00:00:00
end: 2023-10-23 00:00:00
period: 1h
basePeriod: 15m
exchanges: [{"eid":"Futures_Binance","currency":"BTC_USDT"}]
*/
// This source code is subject to the terms of the Mozilla Public License 2.0 at https://mozilla.org/MPL/2.0/
//@version=5
// © A3Sh
// RSI Strategy that buys the dips, uses Price Averaging and Pyramiding.
// When the price drops below specified percentages of the price (8 PA layers), new entries are openend to average the price of the assets.
// Open entries are closed by a specified take profit.
// Entries can be reopened, after closing and consequently crossing a PA layer again.
// This strategy is based on the RSI+PA+DCA strategy I created earlier. The difference is the way the Take Profit is calculated.
// Instead of directly connecting the take profit limit to the decreasing average price level with an X percent above the average price,
// the take profit is calculated for a part on the decreasing average price and for another part on the deduction
// of the profits of the individual closed positions.
// The Take Profit Limit drop less significant then the average price level and the full position only completely exits
// when enough individual closed positions made up for the losses.
// This makes it less risky and more conservative and great for a long term trading strategy
// RSI code is adapted from the build in Relative Strength Index indicator
// MA Filter and RSI concept adapted from the Optimized RSI Buy the Dips strategy, by Coinrule
// https://www.tradingview.com/script/Pm1WAtyI-Optimized-RSI-Strategy-Buy-The-Dips-by-Coinrule/
// Pyramiding entries code adapted from Pyramiding Entries on Early Trends startegy, by Coinrule
// https://www.tradingview.com/script/7NNJ0sXB-Pyramiding-Entries-On-Early-Trends-by-Coinrule/
// Plot entry layers code adapted from HOWTO Plot Entry Price by vitvlkv
// https://www.tradingview.com/script/bHTnipgY-HOWTO-Plot-Entry-Price/
strategy(title='RSI+PA+PTP', pyramiding=16, overlay=true, initial_capital=400, default_qty_type=strategy.percent_of_equity, default_qty_value=15, commission_type=strategy.commission.percent, commission_value=0.075, close_entries_rule='FIFO')
port = input.float(12, group = "Risk", title='Portfolio % Used To Open The 8 Positions', step=0.1, minval=0.1, maxval=100)
q = strategy.equity / 100 * port / open
// Long position PA entry layers. Percentage from the entry price of the the first long
ps2 = input.float(2, group = "Long Position Entry Layers", title='2nd Long Entry %', step=0.1)
ps3 = input.float(3, group = "Long Position Entry Layers", title='3rd Long Entry %', step=0.1)
ps4 = input.float(5, group = "Long Position Entry Layers", title='4th Long Entry %', step=0.1)
ps5 = input.float(10, group = "Long Position Entry Layers", title='5th Long Entry %', step=0.1)
ps6 = input.float(16, group = "Long Position Entry Layers", title='6th Long Entry %', step=0.1)
ps7 = input.float(25, group = "Long Position Entry Layers" ,title='7th Long Entry %', step=0.1)
ps8 = input.float(40, group = "Long Position Entry Layers", title='8th Long Entry %', step=0.1)
// Calculate Moving Averages
plotMA = input.bool(group = "Moving Average Filter", title='Plot Moving Average', defval=false)
movingaverage_signal = ta.sma(close, input(100, group = "Moving Average Filter", title='MA Length'))
plot (plotMA ? movingaverage_signal : na, color = color.new (color.green, 0))
// RSI inputs and calculations
rsiLengthInput = input.int(14, minval=1, title="RSI Length", group="RSI Settings")
rsiSourceInput = input.source(close, "Source", group="RSI Settings")
up = ta.rma(math.max(ta.change(rsiSourceInput), 0), rsiLengthInput)
down = ta.rma(-math.min(ta.change(rsiSourceInput), 0), rsiLengthInput)
rsi = down == 0 ? 100 : up == 0 ? 0 : 100 - (100 / (1 + up / down))
overSold = input.int(29, title="Oversold, Trigger to Enter First Position", group = "RSI Settings")
// Long trigger (co)
co = ta.crossover(rsi, overSold) and close < movingaverage_signal
// Store values to create and plot the different PA layers
long1 = ta.valuewhen(co, close, 0)
long2 = ta.valuewhen(co, close - close / 100 * ps2, 0)
long3 = ta.valuewhen(co, close - close / 100 * ps3, 0)
long4 = ta.valuewhen(co, close - close / 100 * ps4, 0)
long5 = ta.valuewhen(co, close - close / 100 * ps5, 0)
long6 = ta.valuewhen(co, close - close / 100 * ps6, 0)
long7 = ta.valuewhen(co, close - close / 100 * ps7, 0)
long8 = ta.valuewhen(co, close - close / 100 * ps8, 0)
eps1 = 0.00
eps1 := na(eps1[1]) ? na : eps1[1]
eps2 = 0.00
eps2 := na(eps2[1]) ? na : eps2[1]
eps3 = 0.00
eps3 := na(eps3[1]) ? na : eps3[1]
eps4 = 0.00
eps4 := na(eps4[1]) ? na : eps4[1]
eps5 = 0.00
eps5 := na(eps5[1]) ? na : eps5[1]
eps6 = 0.00
eps6 := na(eps6[1]) ? na : eps6[1]
eps7 = 0.00
eps7 := na(eps7[1]) ? na : eps7[1]
eps8 = 0.00
eps8 := na(eps8[1]) ? na : eps8[1]
plot(strategy.position_size > 0 ? eps1 : na, title='Long entry 1', style=plot.style_linebr)
plot(strategy.position_size > 0 ? eps2 : na, title='Long entry 2', style=plot.style_linebr)
plot(strategy.position_size > 0 ? eps3 : na, title='Long entry 3', style=plot.style_linebr)
plot(strategy.position_size > 0 ? eps4 : na, title='Long entry 4', style=plot.style_linebr)
plot(strategy.position_size > 0 ? eps5 : na, title='Long entry 5', style=plot.style_linebr)
plot(strategy.position_size > 0 ? eps6 : na, title='Long entry 6', style=plot.style_linebr)
plot(strategy.position_size > 0 ? eps7 : na, title='Long entry 7', style=plot.style_linebr)
plot(strategy.position_size > 0 ? eps8 : na, title='Long entry 8', style=plot.style_linebr)
// Take Profit Settings
ProfitTarget_Percent = input.float(3.0, group = "Take Profit Settings", title='Take Profit % (Per Position)')
ProfitTarget_Percent_All = input.float(4.0, group = "Take Profit Settings", title='Take Profit % (Exit All, Progressive Take Profit Limit')
TakeProfitProgression = input.float(12, group = "Take Profit Settings", title='Take Profit Progression', tooltip = 'Progression is defined by the position size. By default 12% of the start equity (portfolio) is used to open a position, see Risk. This same % percentage is used to calculate the profit amount that will be deducted from the Take Profit Limit.')
entryOn = input.bool (true, group = "Take Profit Settings", title='New entries affect Take Profit limit', tooltip = 'This option changes the behaviour of the Progressive Take Profit. When switchted on, the difference between the former and current original Take Profit is deducted from the Progressive Take Profit. When switchted off, the Progressive Take Profit is only affected by the profit deduction or each closed position.')
avPricePlot = input.bool (false, group = "Take Profit Settings", title='Plot Average Price (FIFO)')
// Original Take Profit Limit
tpLimit = strategy.position_avg_price + (strategy.position_avg_price / 100 * ProfitTarget_Percent_All)
// Create variables to calculate the Take Profit Limit Progresssion
var endVal = 0.0
var startVal = 0.0
// The value at the the start of the loop is the value of the end of the previous loop
startVal := endVal
// Set variable to the original Take Profit Limit when the first position opens.
if strategy.position_size > 0 and strategy.position_size[1] ==0
endVal := tpLimit
// Everytime a specific position opens, the difference of the previous (original) Take Profit price and the current (original) Take Profit price will be deducted from the Progressive Take Profit Limit
// This feature can be toggled on and off in the settings panel. By default it is toggled on.
entryAmount = 0.0
for i = 1 to strategy.opentrades
entryAmount := i
if entryOn and strategy.position_size > 0 and strategy.opentrades[1] == (entryAmount) and strategy.opentrades == (entryAmount + 1)
endVal := startVal - (tpLimit[1] - tpLimit)
// Everytime a specific position closes, the amount of profit from that specific position will be deducted from the Progressive Take Profit Limit.
exitAmount = 0.0
for id = 1 to strategy.opentrades
exitAmount := id
if strategy.opentrades[1] ==(exitAmount + 1) and strategy.opentrades == (exitAmount)
endVal := startVal - (TakeProfitProgression / 100 * strategy.opentrades.entry_price (id - 1) / 100 * ProfitTarget_Percent )
// The Final Take Profit Price
tpn = (strategy.position_avg_price + (strategy.position_avg_price / 100 * ProfitTarget_Percent_All)) - (strategy.position_avg_price + (strategy.position_avg_price / 100 * ProfitTarget_Percent_All) - endVal)
plot (strategy.position_size > 0 ? tpn : na, title = "Take Profit Limit", color=color.new(color.red, 0), style = plot.style_linebr, linewidth = 1)
// Plot position average price as reference
plot (avPricePlot ? strategy.position_avg_price : na, title= "Average price", color = color.new(color.white, 0), style = plot.style_linebr, linewidth = 1)
// When to trigger the Take Profit per position or the Progressive Take Profit
tpl1 = close < tpn ? eps1 + close * (ProfitTarget_Percent / 100) : tpn
tpl2 = close < tpn ? eps2 + close * (ProfitTarget_Percent / 100) : tpn
tpl3 = close < tpn ? eps3 + close * (ProfitTarget_Percent / 100) : tpn
tpl4 = close < tpn ? eps4 + close * (ProfitTarget_Percent / 100) : tpn
tpl5 = close < tpn ? eps5 + close * (ProfitTarget_Percent / 100) : tpn
tpl6 = close < tpn ? eps6 + close * (ProfitTarget_Percent / 100) : tpn
tpl7 = close < tpn ? eps7 + close * (ProfitTarget_Percent / 100) : tpn
tpl8 = close < tpn ? eps8 + close * (ProfitTarget_Percent / 100) : tpn
// Submit Entry Orders
if co and strategy.opentrades == 0
eps1 := long1
eps2 := long2
eps3 := long3
eps4 := long4
eps5 := long5
eps6 := long6
eps7 := long7
eps8 := long8
strategy.entry('Long1', strategy.long, q)
if strategy.opentrades == 1
strategy.entry('Long2', strategy.long, q, limit=eps2)
if strategy.opentrades == 2
strategy.entry('Long3', strategy.long, q, limit=eps3)
if strategy.opentrades == 3
strategy.entry('Long4', strategy.long, q, limit=eps4)
if strategy.opentrades == 4
strategy.entry('Long5', strategy.long, q, limit=eps5)
if strategy.opentrades == 5
strategy.entry('Long6', strategy.long, q, limit=eps6)
if strategy.opentrades == 6
strategy.entry('Long7', strategy.long, q, limit=eps7)
if strategy.opentrades == 7
strategy.entry('Long8', strategy.long, q, limit=eps8)
// Submit Exit orders
if strategy.position_size > 0
strategy.exit(id='Exit 1', from_entry='Long1', limit=tpl1)
strategy.exit(id='Exit 2', from_entry='Long2', limit=tpl2)
strategy.exit(id='Exit 3', from_entry='Long3', limit=tpl3)
strategy.exit(id='Exit 4', from_entry='Long4', limit=tpl4)
strategy.exit(id='Exit 5', from_entry='Long5', limit=tpl5)
strategy.exit(id='Exit 6', from_entry='Long6', limit=tpl6)
strategy.exit(id='Exit 7', from_entry='Long7', limit=tpl7)
strategy.exit(id='Exit 8', from_entry='Long8', limit=tpl8)
// Make sure that all open limit orders are canceled after exiting all the positions
longClose = strategy.position_size[1] > 0 and strategy.position_size == 0 ? 1 : 0
if longClose
strategy.cancel_all()