Stratégie Breakout Trailing Stop V2


Date de création: 2023-10-24 16:30:32 Dernière modification: 2023-10-24 16:30:32
Copier: 0 Nombre de clics: 1615
1
Suivre
1617
Abonnés

Stratégie Breakout Trailing Stop V2

Aperçu

Cette stratégie combine les avantages d’une stratégie de rupture et d’une stratégie de suivi de la tendance pour capturer les signaux de rupture de la résistance au support dans les graphiques de longue ligne, tout en utilisant les moyennes mobiles pour le suivi de la rupture, pour réaliser des gains dans la direction de la tendance de longue ligne, tout en contrôlant les risques.

Principe de stratégie

  1. La stratégie commence par calculer des moyennes mobiles pour plusieurs groupes de paramètres différents, utilisés respectivement comme jugement de tendance, résistance de support et suivi de stop-loss.

  2. On trouve ensuite les points de résistance de soutien et de résistance d’entrée dans les zones de support et de résistance de bas de la période donnée. Un signal est généré lorsque le prix franchit ces résistances de soutien.

  3. La stratégie consiste à acheter pour faire un signal plus élevé en cas de rupture du sommet et à vendre pour faire un signal plus bas en cas de rupture du sommet.

  4. Après l’entrée en jeu, la position est conservée au niveau de la rupture de la plus basse comme point d’arrêt.

  5. Lorsque la position est entrée en profit, le stop-loss est converti en suivi de la moyenne mobile. Lorsque le prix tombe au-dessous de la moyenne mobile, le stop-loss est défini comme le point le plus bas de la racine K.

  6. Il s’agit d’une méthode qui permet de s’assurer des profits tout en laissant suffisamment d’espace pour suivre la tendance.

  7. La stratégie inclut également les fluctuations réelles moyennes pour s’assurer que les achats de rupture se produisent dans les intervalles appropriés et pour éviter les ruptures d’une expansion excessive.

Analyse des forces stratégiques

  1. Le double avantage de la stratégie de rupture combinée à la stratégie de suivi de la tendance.

  2. Il est possible d’acheter une rupture en fonction de la tendance de la ligne longue, ce qui augmente la probabilité de profit.

  3. La stratégie de stop-loss protège la position tout en la laissant suffisamment d’espace pour fonctionner.

  4. Ajout d’un filtre de volatilité pour éviter une rupture défavorable de la hausse excessive.

  5. Automatisation des transactions, adaptée à une partie du temps de facturation.

  6. La ligne moyenne de différentes périodes peut être personnalisée.

  7. Le suivi des pertes peut être ajusté de manière flexible.

Analyse stratégique des risques

  1. Les stratégies de percée sont sujettes au risque de fausses percées.

  2. Il faut suffisamment d’oscillations pour générer un signal de rupture, qui peut être invalide en cas d’inversion.

  3. Certaines percées peuvent être trop brèves pour être capturées.

  4. Les arrêts de traçage peuvent être trop fréquents en cas de tremblement. La distance d’arrêt peut être allégée de manière appropriée.

  5. Le filtrage du taux de fluctuation peut manquer certaines opportunités. Le paramètre de filtrage peut être réduit.

Orientation de l’optimisation de la stratégie

  1. Testez différentes combinaisons de paramètres de ligne moyenne pour trouver le paramètre optimal.

  2. Tester différents mécanismes de confirmation de percée, tels que le canal, la forme de la ligne K, etc.

  3. Essayez différentes méthodes de suivi des pertes pour trouver la meilleure solution.

  4. Optimiser les stratégies de gestion de fonds, telles que le positionnement.

  5. L’ajout de filtres statistiques améliore la précision du filtrage.

  6. La stratégie a été testée sur différentes variétés.

  7. L’ajout d’algorithmes d’apprentissage automatique améliore l’efficacité de la stratégie.

Résumer

La stratégie intègre la pensée de rupture et la pensée de suivi de la tendance à l’arrêt, ce qui permet d’optimiser l’espace de profit, à condition que le jugement de la ligne longue soit correct. La clé est de trouver la meilleure combinaison de paramètres et de s’associer à une bonne stratégie de gestion de fonds pour saisir les opportunités de longue ligne tout en maîtrisant les risques. La stratégie est susceptible de devenir une stratégie de tendance longue ligne plus fiable grâce à une optimisation supplémentaire.
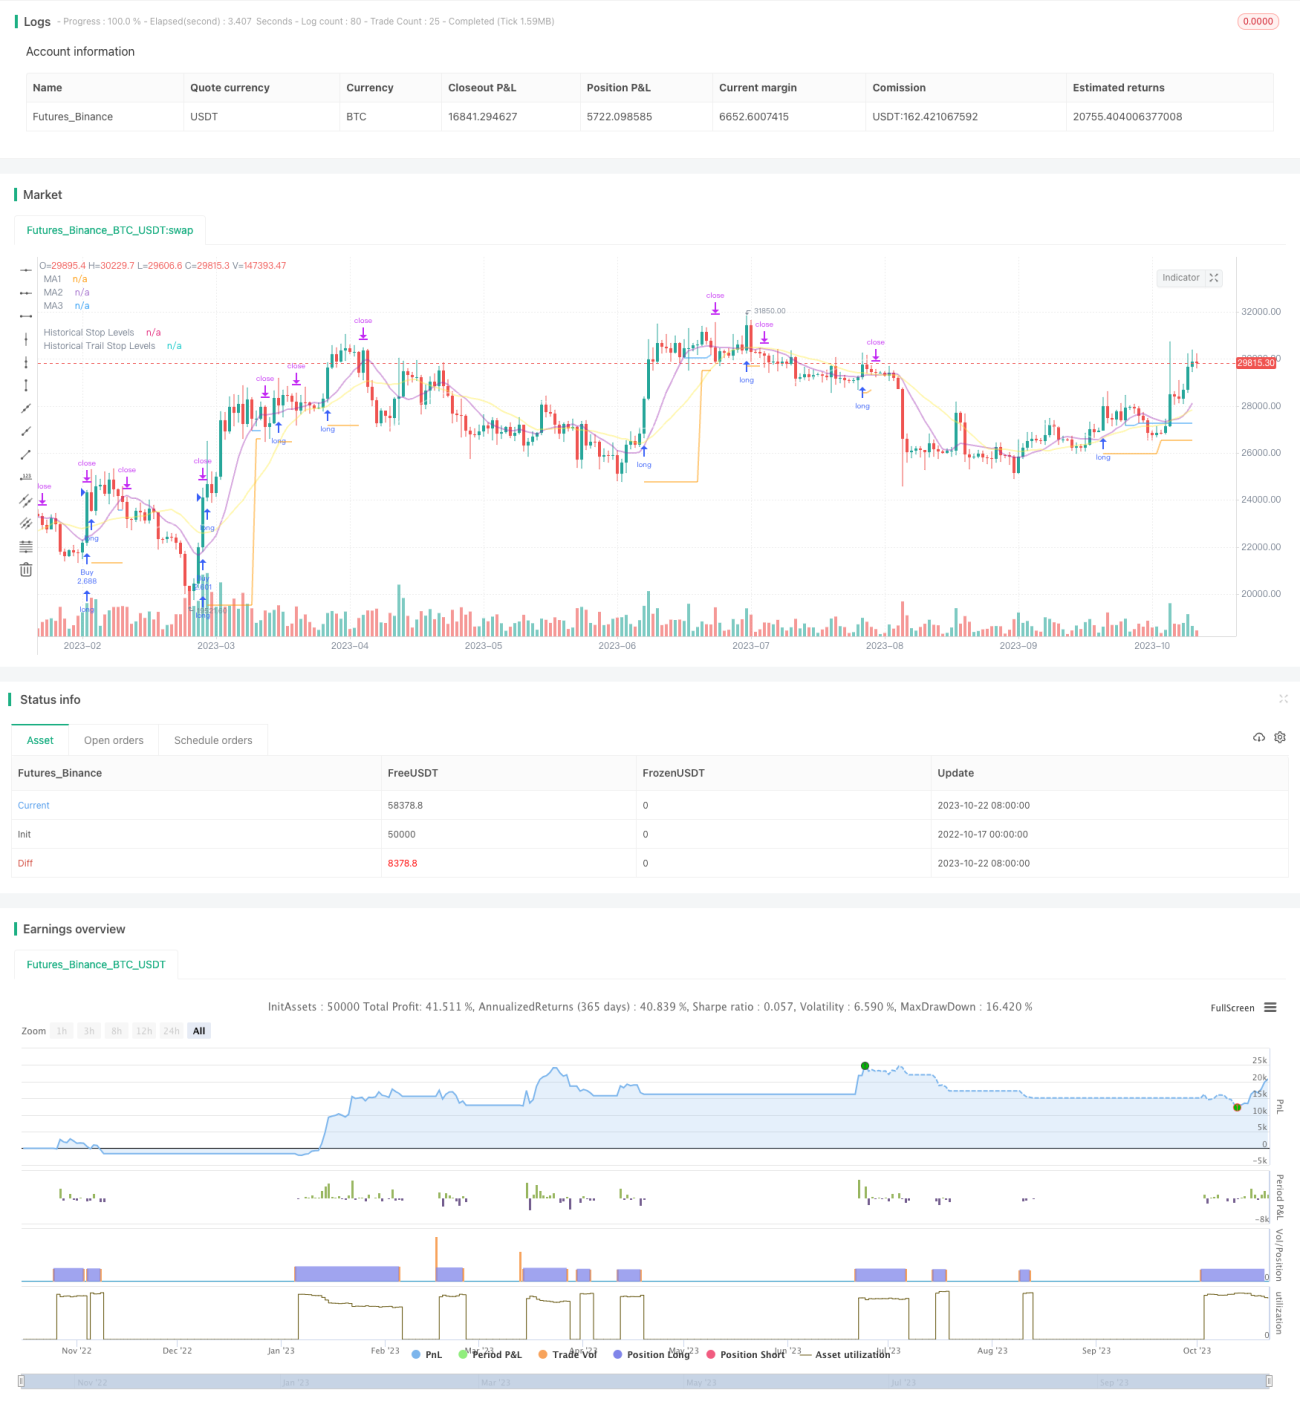
Code source de la stratégie
/*backtest
start: 2022-10-17 00:00:00
end: 2023-10-23 00:00:00
period: 1d
basePeriod: 1h
exchanges: [{"eid":"Futures_Binance","currency":"BTC_USDT"}]
*/

// This source code is subject to the terms of the Mozilla Public License 2.0 at https://mozilla.org/MPL/2.0/
// © millerrh

// The intent of this strategy is to buy breakouts with a tight stop on smaller timeframes in the direction of the longer term trend.
// Then use a trailing stop of a close below either the 10 MA or 20 MA (user choice) on that larger timeframe as the position 
// moves in your favor (i.e. whenever position price rises above the MA).
// Option of using daily ADR as a measure of finding contracting ranges and ensuring a decent risk/reward.
// (If the difference between the breakout point and your stop level is below a certain % of ATR, it could possibly find those consolidating periods.)
// V2 - updates code of original Qullamaggie Breakout to optimize and debug it a bit - the goal is to remove some of the whipsaw and poor win rate of the 
// original by incorporating some of what I learned in the Breakout Trend Follower script.

//@version=4
strategy("Qullamaggie Breakout V2", overlay=true, initial_capital=100000, currency='USD', calc_on_every_tick = true,
   default_qty_type=strategy.percent_of_equity, default_qty_value=100, commission_type=strategy.commission.percent, commission_value=0.1)
   
// === BACKTEST RANGE ===
Start = input(defval = timestamp("01 Jan 2019 06:00 +0000"), title = "Backtest Start Date", type = input.time, group = "backtest window and pivot history")
Finish = input(defval = timestamp("01 Jan 2100 00:00 +0000"), title = "Backtest End Date", type = input.time, group = "backtest window and pivot history")

// Inputs
showPivotPoints = input(title = "Show Historical Pivot Points?", type = input.bool, defval = false, group = "backtest window and pivot history",
  tooltip = "Toggle this on to see the historical pivot points that were used.  Change the Lookback Periods to adjust the frequency of these points.")
htf = input(defval="D", title="Timeframe of Moving Averages", type=input.resolution, group = "moving averages",
  tooltip = "Allows you to set a different time frame for the moving averages and your trailing stop.
  The default behavior is to identify good tightening setups on a larger timeframe
  (like daily) and enter the trade on a breakout occuring on a smaller timeframe, using the moving averages of the larger timeframe to trail your stop.")
maType = input(defval="SMA", options=["EMA", "SMA"], title = "Moving Average Type", group = "moving averages")
ma1Length = input(defval = 10, title = "1st Moving Average Length", minval = 1, group = "moving averages")
ma2Length = input(defval = 20, title = "2nd Moving Average Length", minval = 1, group = "moving averages")
ma3Length = input(defval = 50, title = "3rd Moving Average Length", minval = 1, group = "moving averages")
useMaFilter = input(title = "Use 3rd Moving Average for Filtering?", type = input.bool, defval = true, group = "moving averages",
  tooltip = "Signals will be ignored when price is under this slowest moving average.  The intent is to keep you out of bear periods and only
             buying when price is showing strength or trading with the longer term trend.")
trailMaInput = input(defval="1st Moving Average", options=["1st Moving Average", "2nd Moving Average"], title = "Trailing Stop", group = "stops",
  tooltip = "Initial stops after entry follow the range lows.  Once in profit, the trade gets more wiggle room and
  stops will be trailed when price breaches this moving average.")
trailMaTF = input(defval="Same as Moving Averages", options=["Same as Moving Averages", "Same as Chart"], title = "Trailing Stop Timeframe", group = "stops",
  tooltip = "Once price breaches the trail stop moving average, the stop will be raised to the low of that candle that breached. You can choose to use the
  chart timeframe's candles breaching or use the same timeframe the moving averages use. (i.e. if daily, you wait for the daily bar to close before setting
  your new stop level.)")
currentColorS = input(color.new(color.orange,50), title = "Current Range S/R Colors:    Support", type = input.color, group = "stops", inline = "lineColor")
currentColorR = input(color.new(color.blue,50), title = " Resistance", type = input.color, group = "stops", inline = "lineColor")

// Pivot lookback
lbHigh = 3
lbLow = 3

// MA Calculations (can likely move this to a tuple for a single security call!!)
ma(maType, src, length) =>
    maType == "EMA" ? ema(src, length) : sma(src, length) //Ternary Operator (if maType equals EMA, then do ema calc, else do sma calc)
ma1 = security(syminfo.tickerid, htf, ma(maType, close, ma1Length))
ma2 = security(syminfo.tickerid, htf, ma(maType, close, ma2Length))
ma3 = security(syminfo.tickerid, htf, ma(maType, close, ma3Length))

plot(ma1, color=color.new(color.purple, 60), style=plot.style_line, title="MA1", linewidth=2)
plot(ma2, color=color.new(color.yellow, 60), style=plot.style_line, title="MA2", linewidth=2)
plot(ma3, color=color.new(color.white, 60), style=plot.style_line, title="MA3", linewidth=2)

// === USE ADR FOR FILTERING ===
// The idea here is that you want to buy in a consolodating range for best risk/reward. So here you can compare the current distance between 
// support/resistance vs. the ADR and make sure you aren't buying at a point that is too extended.
useAdrFilter = input(title = "Use ADR for Filtering?", type = input.bool, defval = false, group = "adr filtering",
  tooltip = "Signals will be ignored if the distance between support and resistance is larger than a user-defined percentage of ADR (or monthly volatility
  in the stock screener). This allows the user to ensure they are not buying something that is too extended and instead focus on names that are consolidating more.")
adrPerc = input(defval = 120, title = "% of ADR Value", minval = 1, group = "adr filtering")
tableLocation = input(defval="Bottom", options=["Top", "Bottom"], title = "ADR Table Visibility", group = "adr filtering",
  tooltip = "Place ADR table on the top of the pane, the bottom of the pane, or off.")
adrValue = security(syminfo.tickerid, "D", sma((high-low)/abs(low) * 100, 21)) // Monthly Volatility in Stock Screener (also ADR)
adrCompare = (adrPerc * adrValue) / 100

// === PLOT SWING HIGH/LOW AND MOST RECENT LOW TO USE AS STOP LOSS EXIT POINT ===
ph = pivothigh(high, lbHigh, lbHigh)
pl = pivotlow(low, lbLow, lbLow)
highLevel = valuewhen(ph, high[lbHigh], 0)
lowLevel = valuewhen(pl, low[lbLow], 0)
barsSinceHigh = barssince(ph) + lbHigh
barsSinceLow = barssince(pl) + lbLow
timeSinceHigh = time[barsSinceHigh]
timeSinceLow = time[barsSinceLow]

//Removes color when there is a change to ensure only the levels are shown (i.e. no diagonal lines connecting the levels)
pvthis = fixnan(ph)
pvtlos = fixnan(pl)
hipc = change(pvthis) != 0 ? na : color.new(color.maroon, 0)
lopc = change(pvtlos) != 0 ? na : color.new(color.green, 0)

// Display Pivot lines
plot(showPivotPoints ? pvthis : na, color=hipc, linewidth=1, offset=-lbHigh, title="Top Levels")
plot(showPivotPoints ? pvthis : na, color=hipc, linewidth=1, offset=0, title="Top Levels 2")
plot(showPivotPoints ? pvtlos : na, color=lopc, linewidth=1, offset=-lbLow, title="Bottom Levels")
plot(showPivotPoints ? pvtlos : na, color=lopc, linewidth=1, offset=0, title="Bottom Levels 2")

// BUY AND SELL CONDITIONS
buyLevel = valuewhen(ph, high[lbHigh], 0) //Buy level at Swing High

// Conditions for entry
stopLevel = float(na) // Define stop level here as "na" so that I can reference it in the ADR calculation before the stopLevel is actually defined.
buyConditions = (useMaFilter ? buyLevel > ma3 : true) and
  (useAdrFilter ? (buyLevel - stopLevel[1]) < adrCompare : true) 
buySignal = crossover(high, buyLevel) and buyConditions

// Trailing stop points - when price punctures the moving average, move stop to the low of that candle - Define as function/tuple to only use one security call
trailMa = trailMaInput == "1st Moving Average" ? ma1 : ma2
f_getCross() =>
    maCrossEvent = crossunder(low, trailMa)
    maCross = valuewhen(maCrossEvent, low, 0)
    maCrossLevel = fixnan(maCross)
    maCrossPc = change(maCrossLevel) != 0 ? na : color.new(color.blue, 0) //Removes color when there is a change to ensure only the levels are shown (i.e. no diagonal lines connecting the levels)
    [maCrossEvent, maCross, maCrossLevel, maCrossPc]
crossTF = trailMaTF == "Same as Moving Averages" ? htf : ""
[maCrossEvent, maCross, maCrossLevel, maCrossPc] = security(syminfo.tickerid, crossTF, f_getCross())

plot(showPivotPoints ? maCrossLevel : na, color = maCrossPc, linewidth=1, offset=0, title="Ma Stop Levels")

// == STOP AND PRICE LEVELS ==
inPosition = strategy.position_size > 0
buyLevel := inPosition ? buyLevel[1] : buyLevel
stopDefine = valuewhen(pl, low[lbLow], 0) //Stop Level at Swing Low
inProfit = strategy.position_avg_price <= stopDefine[1]
// stopLevel := inPosition ? stopLevel[1] : stopDefine // Set stop loss based on swing low and leave it there
stopLevel := inPosition and not inProfit ? stopDefine : inPosition and inProfit ? stopLevel[1] : stopDefine // Trail stop loss until in profit
trailStopLevel = float(na)

// trying to figure out a better way for waiting on the trail stop - it can trigger if above the stopLevel even if the MA hadn't been breached since opening the trade
notInPosition = strategy.position_size == 0
inPositionBars = barssince(notInPosition)
maCrossBars = barssince(maCrossEvent)
trailCross = inPositionBars > maCrossBars
// trailCross = trailMa > stopLevel
trailStopLevel := inPosition and trailCross ? maCrossLevel : na

plot(inPosition ? stopLevel : na, style=plot.style_linebr, color=color.new(color.orange, 50), linewidth = 2, title = "Historical Stop Levels", trackprice=false)
plot(inPosition ? trailStopLevel : na, style=plot.style_linebr, color=color.new(color.blue, 50), linewidth = 2, title = "Historical Trail Stop Levels", trackprice=false)

// == PLOT SUPPORT/RESISTANCE LINES FOR CURRENT CHART TIMEFRAME ==
// Use a function to define the lines
// f_line(x1, y1, y2, _color) =>
//     var line id = na
//     line.delete(id)
//     id := line.new(x1, y1, time, y2, xloc.bar_time, extend.right, _color)

// highLine = f_line(timeSinceHigh, highLevel, highLevel, currentColorR)
// lowLine = f_line(timeSinceLow, lowLevel, lowLevel, currentColorS)


// == ADR TABLE ==
tablePos = tableLocation == "Top" ? position.top_right : position.bottom_right
var table adrTable = table.new(tablePos, 2, 1, border_width = 3)
lightTransp = 90
avgTransp   = 80
heavyTransp = 70
posColor = color.rgb(38, 166, 154)
negColor = color.rgb(240, 83, 80)
volColor = color.new(#999999, 0)

f_fillCellVol(_table, _column, _row, _value) =>
    _transp = abs(_value) > 7 ? heavyTransp : abs(_value) > 4 ? avgTransp : lightTransp
    _cellText = tostring(_value, "0.00") + "%\n" + "ADR"
    table.cell(_table, _column, _row, _cellText, bgcolor = color.new(volColor, _transp), text_color = volColor, width = 6)

srDistance = (highLevel - lowLevel)/highLevel * 100

f_fillCellCalc(_table, _column, _row, _value) =>
    _c_color = _value >= adrCompare ? negColor : posColor
    _transp = _value >= adrCompare*0.8 and _value <= adrCompare*1.2 ? lightTransp : 
      _value >= adrCompare*0.5 and _value < adrCompare*0.8 ? avgTransp :
      _value < adrCompare*0.5 ? heavyTransp :
      _value > adrCompare*1.2 and _value <= adrCompare*1.5 ? avgTransp :
      _value > adrCompare*1.5 ? heavyTransp : na
    _cellText = tostring(_value, "0.00") + "%\n" + "Range"
    table.cell(_table, _column, _row, _cellText, bgcolor = color.new(_c_color, _transp), text_color = _c_color, width = 6)

if barstate.islast
    f_fillCellVol(adrTable, 0, 0, adrValue)
    f_fillCellCalc(adrTable, 1, 0, srDistance)
    // f_fillCellVol(adrTable, 0, 0, inPositionBars)
    // f_fillCellCalc(adrTable, 1, 0, maCrossBars)

// == STRATEGY ENTRY AND EXIT ==
strategy.entry("Buy", strategy.long, stop = buyLevel, when = buyConditions)

stop = stopLevel > trailStopLevel ? stopLevel : close[1] > trailStopLevel and close[1] > trailMa ? trailStopLevel : stopLevel
strategy.exit("Sell", from_entry = "Buy", stop=stop)