Stratégie de tendance à court terme basée sur une prise de décision basée sur des indicateurs multidimensionnels

Aperçu
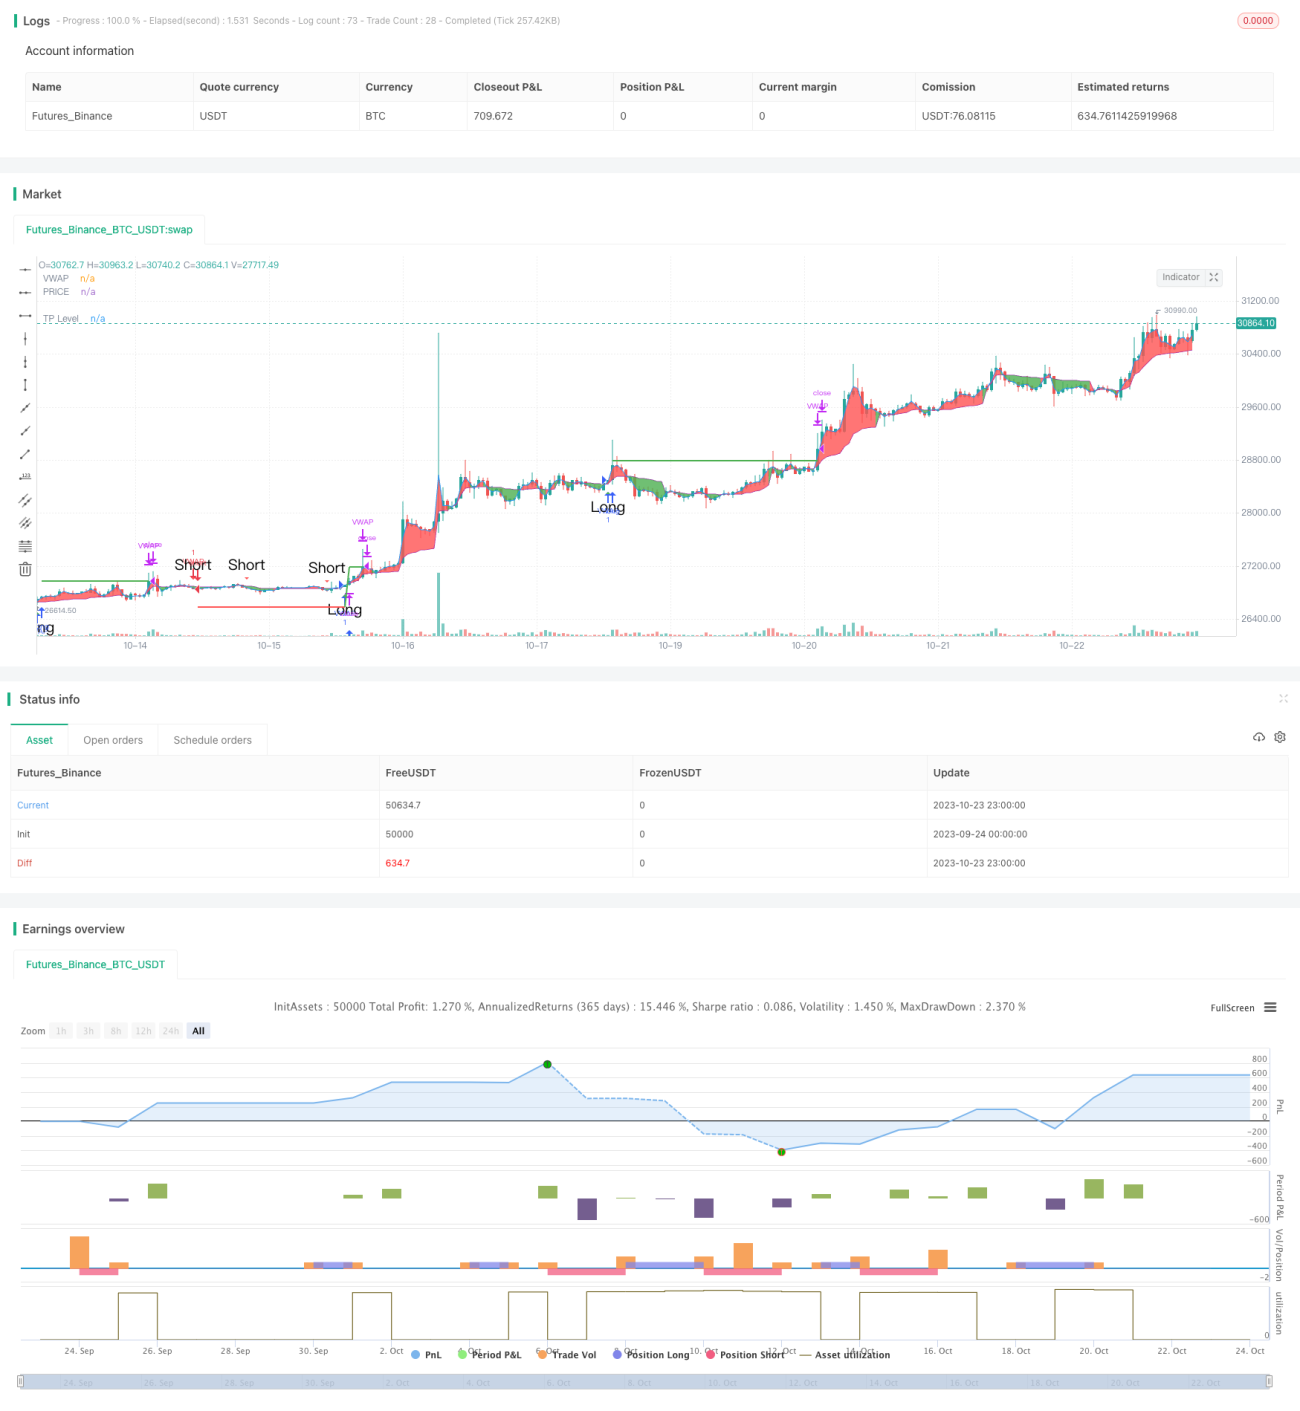
Cette stratégie combine trois dimensions différentes d'indicateurs techniques, à savoir le support de la résistance, le système de ligne moyenne et l'indicateur de survente et de survente, pour déterminer la direction de la tendance à court terme en fonction de leurs signaux combinés, afin d'obtenir un taux de victoire plus élevé.
Principe de stratégie
Le code calcule d'abord les points de résistance au support du prix, y compris l'axe de l'oscillation standard et les points de résistance au support de Fibonacci, et les trace sur un graphique. Lorsque le prix franchit ces points critiques, cela est considéré comme un signal de tendance important.
Ensuite, on calcule les moyennes mobiles pondérées VWAP et les prix moyens, et on juge leur signal de croix dorée et de jonction morte.
Enfin, le Stochastic RSI est calculé pour déterminer si son signal de croix dorée et son signal de fourche morte appartiennent à l'indicateur de surachat/survente.
En combinant les trois dimensions de l'indicateur, si le support de la résistance, la ligne moyenne VWAP et le RSI stochastique émettent simultanément un signal d'achat, il y a un surenchère; si les trois émettent simultanément un signal de vente, il y a un vide.
Analyse des avantages
Le plus grand avantage de cette stratégie réside dans la combinaison de trois indicateurs de différentes dimensions, ce qui rend le jugement plus complet et plus précis. Tout d'abord, le niveau de résistance soutient le jugement de la grande tendance; ensuite, le VWAP juge la tendance de la ligne moyenne; enfin, le RSI stochastique juge la situation de survente. Les indicateurs tridimensionnels émettent simultanément des signaux qui peuvent filtrer les faux signaux et améliorer considérablement le taux de réussite de l'entrée.
En outre, la stratégie a ajouté une fonction de blocage qui permet de verrouiller un certain pourcentage de bénéfices, ce qui est avantageux pour la gestion des fonds.
Analyse des risques
Le principal risque de cette stratégie réside dans le fait que la prise de décision à long terme dépend de la synchronisation des signaux des indicateurs, ce qui peut entraîner une erreur de décision si certains indicateurs émettent des signaux erronés. Par exemple, le RSI stochastique émet un signal de surachat, mais le VWAP et le jugement de résistance de soutien restent pessimistes, ce qui peut entraîner la perte d'un point d'achat et ne pas entrer en jeu.
En outre, une mauvaise configuration des paramètres de l'indicateur peut également entraîner une erreur de jugement du signal, ce qui nécessite de trouver les paramètres optimaux par des tests répétés.
En outre, les marchés boursiers sont souvent confrontés à des événements à courte échéance qui entraînent l'échec de l'indicateur. Pour prévenir ce risque, il est possible d'adhérer à une stratégie de stop-loss pour éviter des pertes individuelles excessives.
Direction d'optimisation
Cette stratégie peut être optimisée de plusieurs façons:
-
Ajouter plus de signaux d'indicateurs, tels que le volume de transactions, pour juger de la force ou de la faiblesse des tendances et améliorer la précision des décisions.
-
L'ajout de modèles d'apprentissage automatique, la formation sur des indicateurs multidimensionnels et la recherche automatique des stratégies de négociation optimales.
-
Optimiser en fonction des paramètres des différentes variétés, en définissant des paramètres d'adaptation.
-
Augmentation des stratégies de stop-loss et de contrôle des risques en fonction de la taille des positions de contrôle de retraits.
-
Optimiser le regroupement, trouver des variétés peu pertinentes pour le regroupement, réduire le retrait du regroupement.
Résumer
Cette stratégie est tout à fait adaptée au trading de tendances à court terme. Elle utilise des indicateurs multidimensionnels pour prendre des décisions, elle permet de filtrer beaucoup de bruit et a un taux de victoire élevé. Cependant, il convient de garder à l'esprit le risque que les indicateurs émettent de faux signaux.
- 1