
La stratégie combine les deux indicateurs EMA et l’indicateur Williams pour identifier la direction de la tendance et la suivre lorsque la tendance est forte. Son idée de base est la suivante:
La stratégie utilise les deux EMA, l’EMA à court terme et l’EMA à long terme. Elle utilise les deux EMA pour capturer les tendances à moyen et long terme.
En outre, la stratégie est combinée avec l’indicateur Williams pour identifier les inversions. L’indicateur Williams détermine si le prix est en survente ou en survente en déterminant les hauts et les bas de la période.
La logique de jugement dans le code est la suivante:
Entrée multiple: les EMA à court terme sont croisées par les EMA à moyen terme et les EMA à long terme, et l’indicateur Williams affiche une zone de survente et forme un minimum dans la zone de survente, indiquant une opportunité de reprise, ce qui génère un signal d’achat.
Entrée en bourse: les EMA à court terme traversent les EMA à moyen terme et les EMA à long terme, et l’indicateur Williams affiche une zone de survente et forme un sommet dans la zone de survente, indiquant une opportunité de reprise, à laquelle se rapporte un signal de vente.
En outre, l’introduction de l’indicateur RSI dans la stratégie a permis de confirmer davantage les signaux de trading et d’éviter la poursuite aveugle de la baisse.
Le plus grand avantage de cette stratégie réside dans le fait qu’elle utilise les doubles EMA pour filtrer un grand nombre de tendances inefficaces, en sélectionnant uniquement les tendances les plus fortes à moyen et long terme pour les suivre, afin de filtrer le bruit et de réduire les transactions inefficaces.
En outre, l’introduction de l’indicateur Williams a également eu un très bon effet. Premièrement, il permet d’identifier les opportunités de reprise, permettant ainsi une liquidation en temps opportun; deuxièmement, il permet de confirmer davantage l’efficacité des signaux de tendance.
La combinaison des deux EMA et des Willams permet à la stratégie d’obtenir de bons gains de suivi dans les variétés à moyen et long terme, tout en permettant d’identifier les inversions et de limiter les pertes.
Le risque principal de cette stratégie réside dans la difficulté d’identifier les points de retournement de tendance. Malgré l’introduction de l’indicateur Williams et de l’indicateur RSI pour assurer l’efficacité des opérations de retournement, la difficulté de l’opération de retournement est toujours grande et le risque de reprise de la baisse ne peut pas être complètement évité.
En outre, le portefeuille double EMA présente lui-même un certain retard. Il peut également être difficile pour la stratégie d’identifier les tendances à court terme et les tendances à moyen et long terme lorsqu’elles sont déconnectées.
Cette stratégie peut être optimisée dans les domaines suivants:
Tester plus de combinaisons de cycles EMA pour trouver de meilleurs paramètres
Ajout d’un mécanisme d’exit adaptatif, en utilisant des indicateurs tels que l’ATR et l’indice de volatilité pour déterminer le renversement de tendance
Ajout d’éléments d’apprentissage automatique pour les prévisions de tendances et de retournements
Utilisation de la théorie des vagues et d’autres méthodes pour améliorer les règles de négociation inverse
Introduction d’une gestion de position adaptative, permettant d’ajuster la taille des positions en fonction des conditions du marché
Cette stratégie a réussi à combiner les deux EMA et les indicateurs Williams pour capturer les tendances à moyen et long terme et obtenir des rendements plus élevés dans les grandes tendances. En même temps, l’introduction de l’indicateur Williams permet également à la stratégie de reconnaître les retournements et de stopper les pertes à temps.
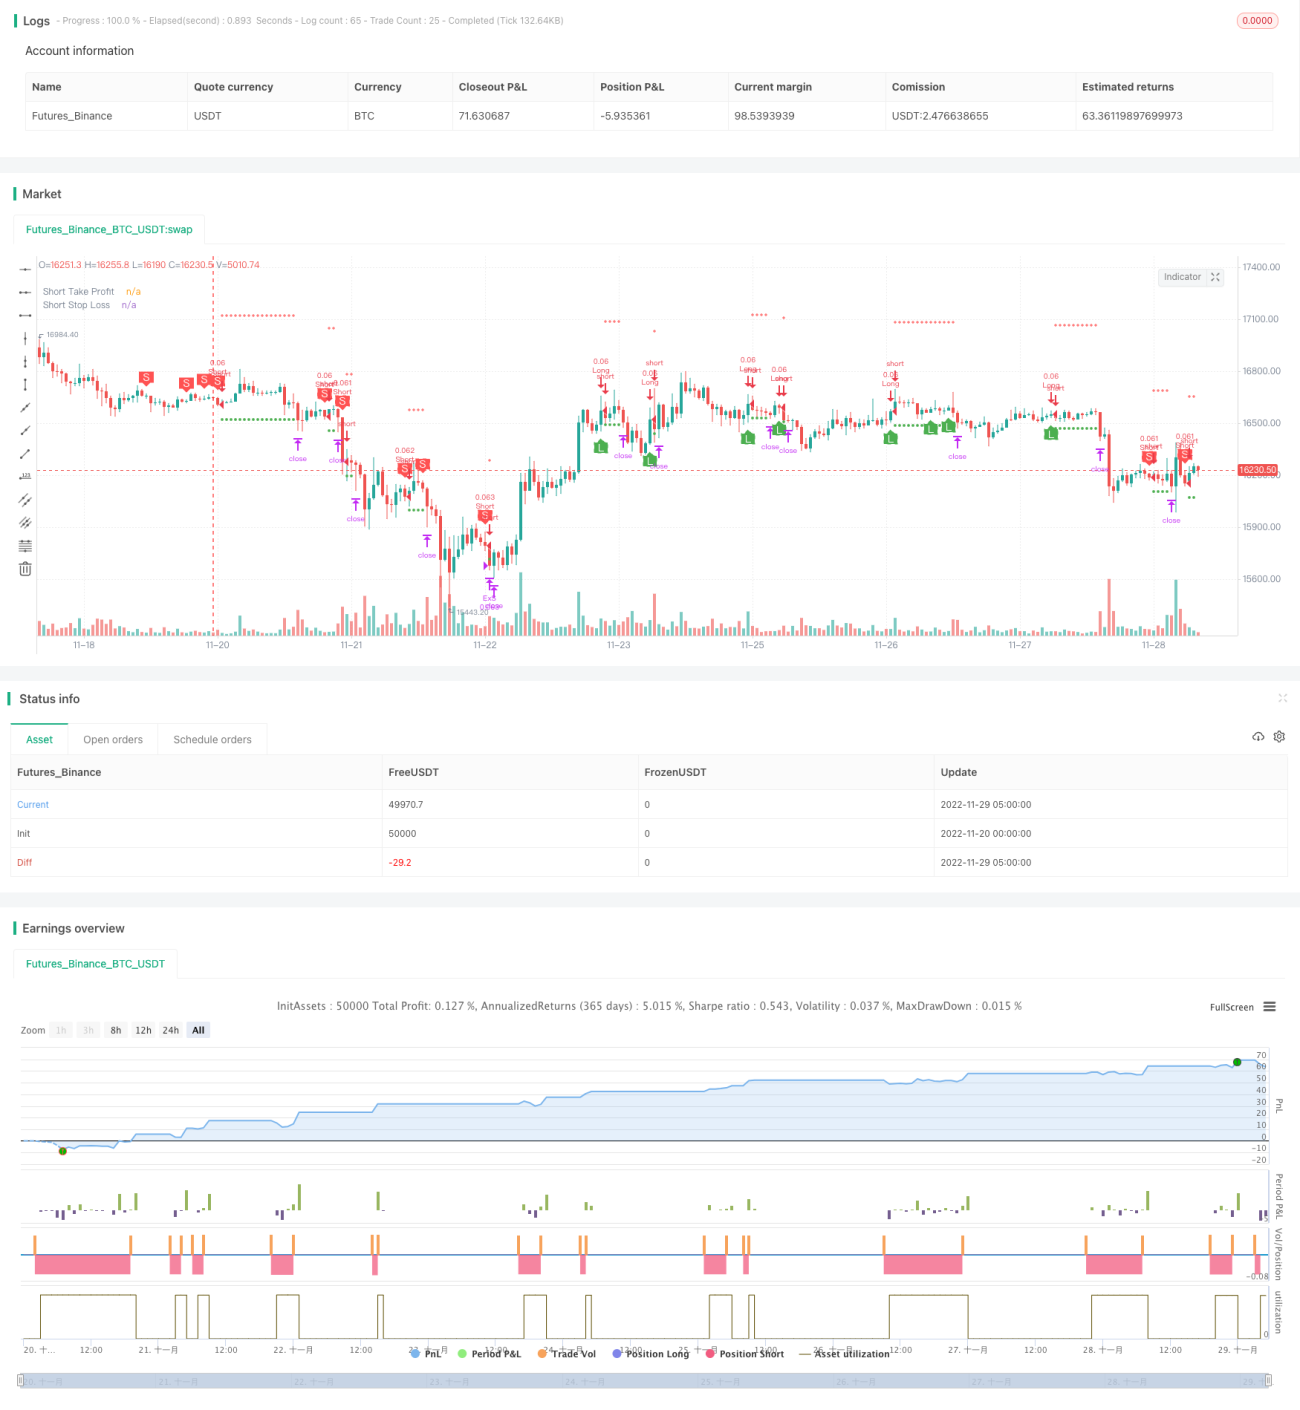
/*backtest
start: 2022-11-20 00:00:00
end: 2022-11-29 05:20:00
period: 1h
basePeriod: 15m
exchanges: [{"eid":"Futures_Binance","currency":"BTC_USDT"}]
*/
// This source code is subject to the terms of the Mozilla Public License 2.0 at https://mozilla.org/MPL/2.0/
// © B_L_A_C_K_S_C_O_R_P_I_O_N
// v 1.1
//@version=4
strategy("vijkirti buy sell 99%", overlay=true, default_qty_type=strategy.cash, default_qty_value=1000, currency='USD')
// *************Appearance*************
theme = input(type=input.string, defval="dark", options=["light","dark"], group="Appearance")
show_fractals = input(false, "Show Fractals", group="Appearance")
show_ema = input(false, "Show EMAs", group="Appearance")
// *************colors*************
color_green = color.green
color_red = color.red
color_yellow = color.yellow
color_orange = color.orange
color_blue = color.blue
color_white = color.white
// *************WF*************
// Define "n" as the number of periods and keep a minimum value of 2 for error handling.
n = input(title="Fractal Periods", defval=2, minval=2, type=input.integer, group="Williams Fractals")
// UpFractal
bool upflagDownFrontier = true
bool upflagUpFrontier0 = true
bool upflagUpFrontier1 = true
bool upflagUpFrontier2 = true
bool upflagUpFrontier3 = true
bool upflagUpFrontier4 = true
for i = 1 to n
upflagDownFrontier := upflagDownFrontier and (high[n-i] < high[n])
upflagUpFrontier0 := upflagUpFrontier0 and (high[n+i] < high[n])
upflagUpFrontier1 := upflagUpFrontier1 and (high[n+1] <= high[n] and high[n+i + 1] < high[n])
upflagUpFrontier2 := upflagUpFrontier2 and (high[n+1] <= high[n] and high[n+2] <= high[n] and high[n+i + 2] < high[n])
upflagUpFrontier3 := upflagUpFrontier3 and (high[n+1] <= high[n] and high[n+2] <= high[n] and high[n+3] <= high[n] and high[n+i + 3] < high[n])
upflagUpFrontier4 := upflagUpFrontier4 and (high[n+1] <= high[n] and high[n+2] <= high[n] and high[n+3] <= high[n] and high[n+4] <= high[n] and high[n+i + 4] < high[n])
flagUpFrontier = upflagUpFrontier0 or upflagUpFrontier1 or upflagUpFrontier2 or upflagUpFrontier3 or upflagUpFrontier4
upFractal = (upflagDownFrontier and flagUpFrontier)
// downFractal
bool downflagDownFrontier = true
bool downflagUpFrontier0 = true
bool downflagUpFrontier1 = true
bool downflagUpFrontier2 = true
bool downflagUpFrontier3 = true
bool downflagUpFrontier4 = true
for i = 1 to n
downflagDownFrontier := downflagDownFrontier and (low[n-i] > low[n])
downflagUpFrontier0 := downflagUpFrontier0 and (low[n+i] > low[n])
downflagUpFrontier1 := downflagUpFrontier1 and (low[n+1] >= low[n] and low[n+i + 1] > low[n])
downflagUpFrontier2 := downflagUpFrontier2 and (low[n+1] >= low[n] and low[n+2] >= low[n] and low[n+i + 2] > low[n])
downflagUpFrontier3 := downflagUpFrontier3 and (low[n+1] >= low[n] and low[n+2] >= low[n] and low[n+3] >= low[n] and low[n+i + 3] > low[n])
downflagUpFrontier4 := downflagUpFrontier4 and (low[n+1] >= low[n] and low[n+2] >= low[n] and low[n+3] >= low[n] and low[n+4] >= low[n] and low[n+i + 4] > low[n])
flagDownFrontier = downflagUpFrontier0 or downflagUpFrontier1 or downflagUpFrontier2 or downflagUpFrontier3 or downflagUpFrontier4
downFractal = (downflagDownFrontier and flagDownFrontier)
plotshape(downFractal and show_fractals, style=shape.triangleup, location=location.belowbar, offset=-n, color=color_green)
plotshape(upFractal and show_fractals, style=shape.triangledown, location=location.abovebar, offset=-n, color=color_red)
// *************EMA*************
len_a = input(20, minval=1, title="EMA Length A", group="EMA")
src_a = input(close, title="EMA Source A", group="EMA")
offset_a = input(title="EMA Offset A", type=input.integer, defval=0, minval=-500, maxval=500, group="EMA")
out_a = ema(src_a, len_a)
plot(show_ema ? out_a : na, title="EMA A", color=color_green, offset=offset_a)
len_b = input(50, minval=1, title="EMA Length B", group="EMA")
src_b = input(close, title="EMA Source B", group="EMA")
offset_b = input(title="EMA Offset B", type=input.integer, defval=0, minval=-500, maxval=500, group="EMA")
out_b = ema(src_b, len_b)
ema_b_color = (theme == "dark") ? color_yellow : color_orange
plot(show_ema ? out_b : na, title="EMA B", color=ema_b_color, offset=offset_b)
len_c = input(100, minval=1, title="EMA Length C", group="EMA")
src_c = input(close, title="EMA Source C", group="EMA")
offset_c = input(title="EMA Offset C", type=input.integer, defval=0, minval=-500, maxval=500, group="EMA")
out_c = ema(src_c, len_c)
ema_c_color = (theme == "dark") ? color_white : color_blue
plot(show_ema ? out_c : na, title="EMA C", color=ema_c_color, offset=offset_c)
// *************RSI*************
rsi_len = input(14, minval=1, title="RSI Length", group="RSI")
rsi_src = input(close, "RSI Source", type = input.source, group="RSI")
up = rma(max(change(rsi_src), 0), rsi_len)
down = rma(-min(change(rsi_src), 0), rsi_len)
rsi = down == 0 ? 100 : up == 0 ? 0 : 100 - (100 / (1 + up / down))
// *************Calculation*************
long = (out_a > out_b) and (out_a > out_c) and downFractal and low[2] > out_c and rsi[2] < rsi
short = (out_a < out_b) and (out_a < out_c) and upFractal and high[2] < out_c and rsi[2] > rsi
plotshape(long, style=shape.labelup, color=color_green, location=location.belowbar, title="long label", text= "L", textcolor=color_white)
plotshape(short, style=shape.labeldown, color=color_red, location=location.abovebar, title="short label", text= "S", textcolor=color_white)
// *************End of Signals calculation*************
// Make input options that configure backtest date range
startDate = input(title="Start Date", type=input.integer,
defval=1, minval=1, maxval=31, group="Orders")
startMonth = input(title="Start Month", type=input.integer,
defval=1, minval=1, maxval=12, group="Orders")
startYear = input(title="Start Year", type=input.integer,
defval=2018, minval=1800, maxval=2100, group="Orders")
endDate = input(title="End Date", type=input.integer,
defval=1, minval=1, maxval=31, group="Orders")
endMonth = input(title="End Month", type=input.integer,
defval=12, minval=1, maxval=12, group="Orders")
endYear = input(title="End Year", type=input.integer,
defval=2022, minval=1800, maxval=2100, group="Orders")
// Look if the close time of the current bar
// falls inside the date range
inDateRange = (time >= timestamp(syminfo.timezone, startYear,
startMonth, startDate, 0, 0)) and
(time < timestamp(syminfo.timezone, endYear, endMonth, endDate, 0, 0))
// Make inputs that set the take profit % (optional)
longProfitPerc = input(title="Long Take Profit (%)",
type=input.float, minval=0.0, step=0.1, defval=0.5, group="Orders") * 0.01
shortProfitPerc = input(title="Short Take Profit (%)",
type=input.float, minval=0.0, step=0.1, defval=0.5, group="Orders") * 0.01
// Figure out take profit price
longExitPrice = strategy.position_avg_price * (1 + longProfitPerc)
shortExitPrice = strategy.position_avg_price * (1 - shortProfitPerc)
// Plot take profit values for confirmation
plot(series=(strategy.position_size > 0) ? longExitPrice : na,
color=color_green, style=plot.style_circles,
linewidth=1, title="Long Take Profit")
plot(series=(strategy.position_size < 0) ? shortExitPrice : na,
color=color_green, style=plot.style_circles,
linewidth=1, title="Short Take Profit")
// Submit entry orders
if (inDateRange and long and strategy.opentrades == 0)
strategy.entry(id="Long", long=true)
if (inDateRange and short and strategy.opentrades == 0)
strategy.entry(id="Short", long=false)
// Set stop loss level with input options (optional)
longLossPerc = input(title="Long Stop Loss (%)",
type=input.float, minval=0.0, step=0.1, defval=3.1, group="Orders") * 0.01
shortLossPerc = input(title="Short Stop Loss (%)",
type=input.float, minval=0.0, step=0.1, defval=3.1, group="Orders") * 0.01
// Determine stop loss price
longStopPrice = strategy.position_avg_price * (1 - longLossPerc)
shortStopPrice = strategy.position_avg_price * (1 + shortLossPerc)
// Plot stop loss values for confirmation
plot(series=(strategy.position_size > 0) ? longStopPrice : na,
color=color_red, style=plot.style_cross,
linewidth=1, title="Long Stop Loss")
plot(series=(strategy.position_size < 0) ? shortStopPrice : na,
color=color_red, style=plot.style_cross,
linewidth=1, title="Short Stop Loss")
// Submit exit orders based on calculated stop loss price
if (strategy.position_size > 0)
strategy.exit(id="ExL",limit=longExitPrice, stop=longStopPrice)
if (strategy.position_size < 0)
strategy.exit(id="ExS", limit=shortExitPrice, stop=shortStopPrice)
// Exit open market position when date range ends
if (not inDateRange)
strategy.close_all()