Stratégie quantitative du graphique en nuage Ichimoku
Aperçu
Il s’agit d’une stratégie de quantification du nuage d’Ichimoku qui consiste à faire plus. La stratégie consiste à déterminer la direction de la tendance à l’aide de l’indicateur d’Ichimoku, en combinant la forme de la ligne K, les moyennes mobiles et les signaux de filtrage de l’indicateur Stochastic RSI pour choisir le meilleur point d’entrée lorsque la tendance est à la hausse.
Principe de stratégie
Les principaux critères de cette stratégie sont les suivants:
- La ligne de pointe 2 est traversée par la ligne de pointe 1 d’Ichimoku, ce qui indique une reprise de tendance.
- La ligne K traverse la ligne de tête 1 au cours de la clôture et est conforme aux conditions de suivi de la tendance
- La ligne K est la ligne Y, tendance à la hausse
- Lorsque vous activez la moyenne mobile, demandez à la ligne rapide de passer la ligne lente.
- Lorsque Stochastic RSI est activé, demandez à la ligne K de traverser la ligne D
Si les conditions ci-dessus sont réunies, la stratégie ouvre une position plus élevée; si le prix tombe au-dessous de la ligne de tête 1, la stratégie est levée.
La stratégie utilise principalement le diagramme de nuage d’Ichimoku pour déterminer la direction de la tendance principale, puis se combine avec des signaux de filtrage d’indicateurs auxiliaires pour choisir les meilleurs points d’entrée lorsque la tendance est à la hausse.
Avantages stratégiques
- Le retour en arrière montre une grande précision dans la détermination des tendances principales à l’aide du diagramme de nuages d’Ichimoku.
- La combinaison de plusieurs indicateurs auxiliaires pour filtrer les points d’entrée peut augmenter considérablement le taux de profit
- La seule stratégie qui s’applique aux monnaies jugées à plusieurs têtes
- Il y a beaucoup de place pour optimiser les paramètres et les paramètres de l’indicateur peuvent être ajustés pour optimiser davantage
Risque stratégique
- Il y a une probabilité de défaillance de la carte des nuages d’Ichimoku, qui pourrait mal interpréter la tendance
- Les points de rupture peuvent être franchis en cas de rupture et entraîner une augmentation des pertes.
- Des devises conçues pour des échanges à plusieurs têtes et qui ne sont pas adaptées aux échanges qui cachent des signes de tendance
- Une mauvaise configuration des paramètres peut entraîner une entrée trop intense ou trop conservatrice
La réponse:
- Une meilleure précision des jugements, combinée à une meilleure compréhension des tendances
- Il est important de définir des points de rupture raisonnables et de contrôler les pertes individuelles.
- Sélectionnez des stratégies en fonction des différentes devises
- Test et optimisation minutieuse des paramètres pour une stratégie plus stable
Orientation de l’optimisation de la stratégie
- Optimisation des paramètres de l’indicateur auxiliaire pour améliorer encore la stabilité de la stratégie
- Ajout de mécanismes de stop-loss, tels que le suivi des stops, les stops des moyennes mobiles des indices, etc.
- Augmentation de la gestion des positions, par exemple les positions fixes, les positions moyennes, etc.
- Optimisation des paramètres pour une devise spécifique
Résumer
La stratégie de quantification de l’Ichimoku Cloud est une stratégie unique à plusieurs têtes, permettant de déterminer la direction de la tendance, de réaliser un taux de réussite élevé et un risque maîtrisé. L’avantage de la stratégie est évident et son effet est remarquable dans les situations à plusieurs têtes. La prochaine étape peut être améliorée en termes d’optimisation des indicateurs, de mécanisme de stop-loss, de gestion de position, etc., pour rendre la stratégie plus parfaite et plus stable.
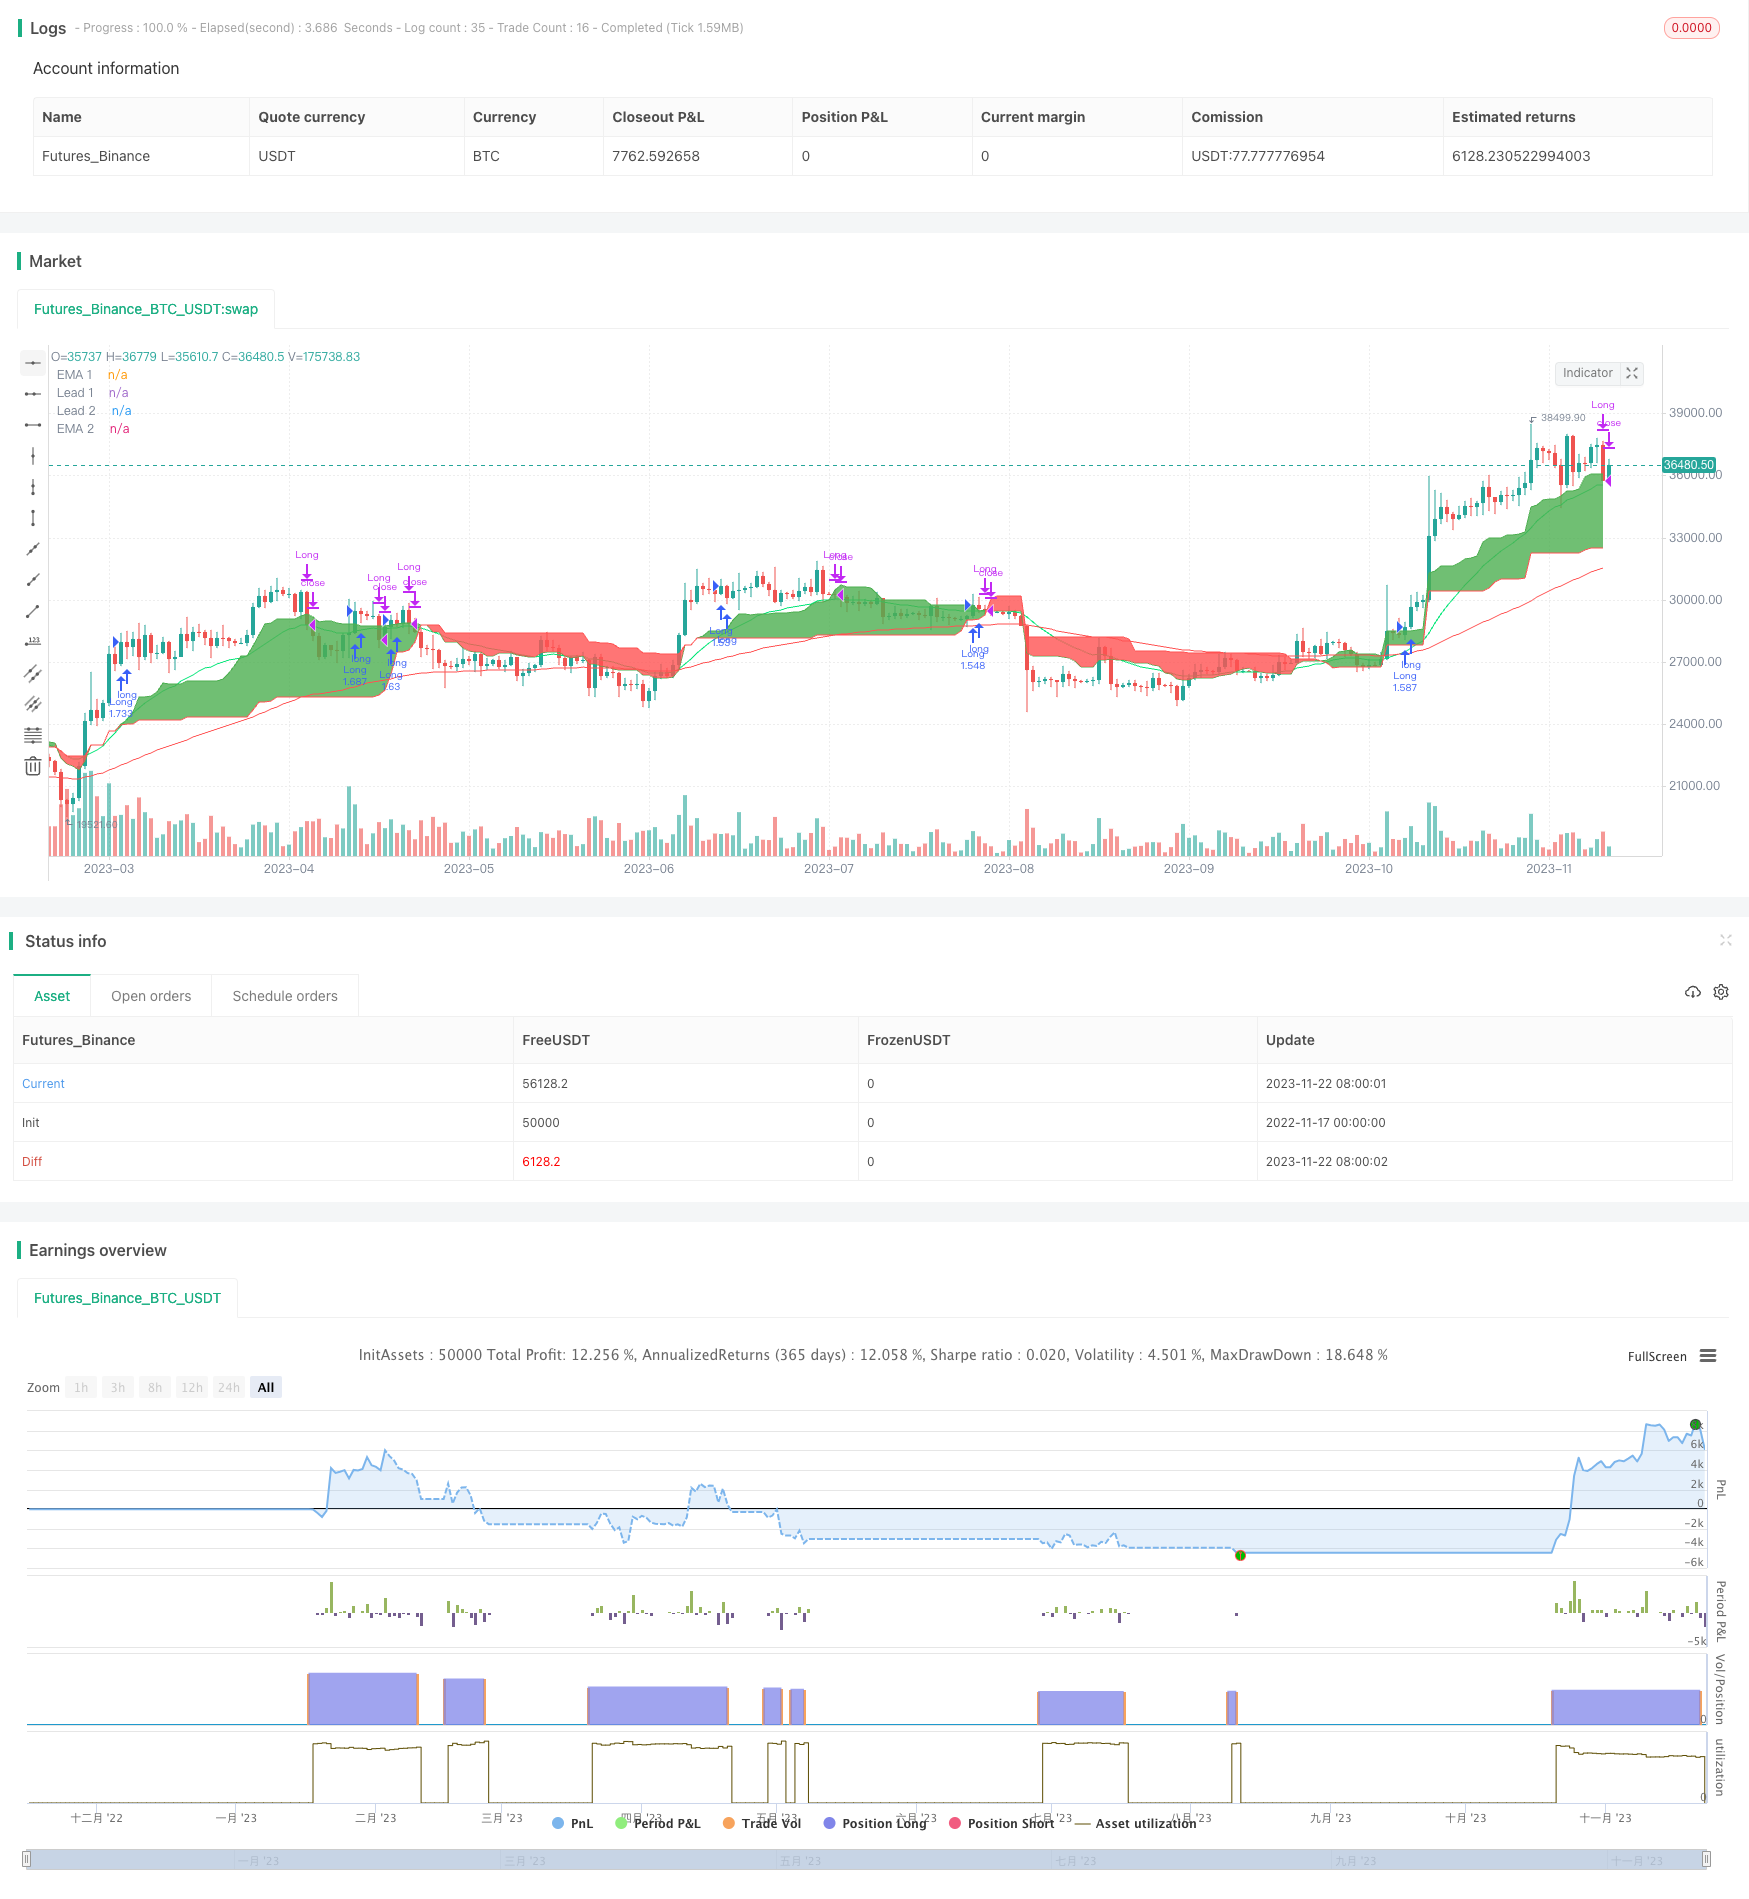
/*backtest
start: 2022-11-17 00:00:00
end: 2023-11-23 00:00:00
period: 1d
basePeriod: 1h
exchanges: [{"eid":"Futures_Binance","currency":"BTC_USDT"}]
*/

//@version=4

strategy(title="Ichimoku only Long Strategy", shorttitle="Ichimoku only Long", overlay = true, pyramiding = 0, calc_on_order_fills = false, commission_type =  strategy.commission.percent, commission_value = 0, default_qty_type = strategy.percent_of_equity, default_qty_value = 100, initial_capital=10000, currency=currency.USD)

// Time Range
FromMonth=input(defval=1,title="FromMonth",minval=1,maxval=12)
FromDay=input(defval=1,title="FromDay",minval=1,maxval=31)
FromYear=input(defval=2017,title="FromYear",minval=2017)
ToMonth=input(defval=1,title="ToMonth",minval=1,maxval=12)
ToDay=input(defval=1,title="ToDay",minval=1,maxval=31)
ToYear=input(defval=9999,title="ToYear",minval=2017)
start=timestamp(FromYear,FromMonth,FromDay,00,00)
finish=timestamp(ToYear,ToMonth,ToDay,23,59)
window()=>true
// See if this bar's time happened on/after start date
afterStartDate = time >= start and time<=finish?true:false

//Enable RSI
enableema = input(true, title="Enable EMA?")
enablestochrsi = input(false, title="Enable Stochastik RSI?")

//EMA
emasrc = close,
len1 = input(24, minval=1, title="EMA 1")
len2 = input(90, minval=1, title="EMA 2")

ema1 = ema(emasrc, len1)
ema2 = ema(emasrc, len2)

col1 = color.lime
col2 = color.red

//EMA Plots
plot(ema1, title="EMA 1", linewidth=1, color=col1)
plot(ema2, title="EMA 2", linewidth=1, color=col2)

//STOCH RSI
smoothK = input(3, minval=1, title="RSI K Line")
smoothD = input(3, minval=1, title="RSI D Line")
lengthRSI = input(14, minval=1, title="RSI Length")
lengthStoch = input(14, minval=1, title="Stochastik Length")
src = input(close, title="RSI Source")

rsi1 = rsi(src, lengthRSI)
k = sma(stoch(rsi1, rsi1, rsi1, lengthStoch), smoothK)
d = sma(k, smoothD)

//Ichimoku
conversionPeriods = input(9, minval=1, title="Ichi Conversion Line Length")
basePeriods = input(26, minval=1, title="Ichi Base Line Length")
laggingSpan2Periods = input(52, minval=1, title="Ichi Lagging Span 2 Length")
displacement = input(1, minval=0, title="Ichi Displacement")
donchian(len) => avg(lowest(len), highest(len))
conversionLine = donchian(conversionPeriods)
baseLine = donchian(basePeriods)
leadLine1 = avg(conversionLine, baseLine)
leadLine2 = donchian(laggingSpan2Periods)
p1 = plot(leadLine1, offset = displacement - 1, color=color.green,
	 title="Lead 1")
p2 = plot(leadLine2, offset = displacement - 1, color=color.red,
	 title="Lead 2")
fill(p1, p2, color = leadLine1 > leadLine2 ? color.green : color.red)


//Long Condition
crossup = k[0] > d[0] and k[1] <= d[1]
ichigreenabovered = leadLine1 > leadLine2
ichimokulong = close > leadLine1
greencandle =  close > open
redcandle = close < open
emacond = ema1 > ema2
longcondition = ichigreenabovered and ichimokulong and greencandle

//Exit Condition
ichimokuexit = close < leadLine1

exitcondition = ichimokuexit and redcandle

//Entrys

if (enablestochrsi == false) and (enableema == false) and (longcondition) and (afterStartDate) and (strategy.opentrades < 1)
    strategy.entry("Long", strategy.long)

if (enablestochrsi == true) and (enableema == false) and (longcondition) and (crossup) and (afterStartDate) and (strategy.opentrades < 1)
    strategy.entry("Long", strategy.long)

if (enableema == true) and (enablestochrsi == false) and (longcondition) and (emacond) and (afterStartDate) and (strategy.opentrades < 1)
    strategy.entry("Long", strategy.long)

if (enableema == true) and (enablestochrsi == true) and (longcondition) and (emacond) and (crossup) and (afterStartDate) and (strategy.opentrades < 1)
    strategy.entry("Long", strategy.long)


//Exits
if (afterStartDate)
    strategy.close(id = "Long", when = exitcondition)