Stratégie de suivi de tendance basée sur l'indicateur CCI
Aperçu
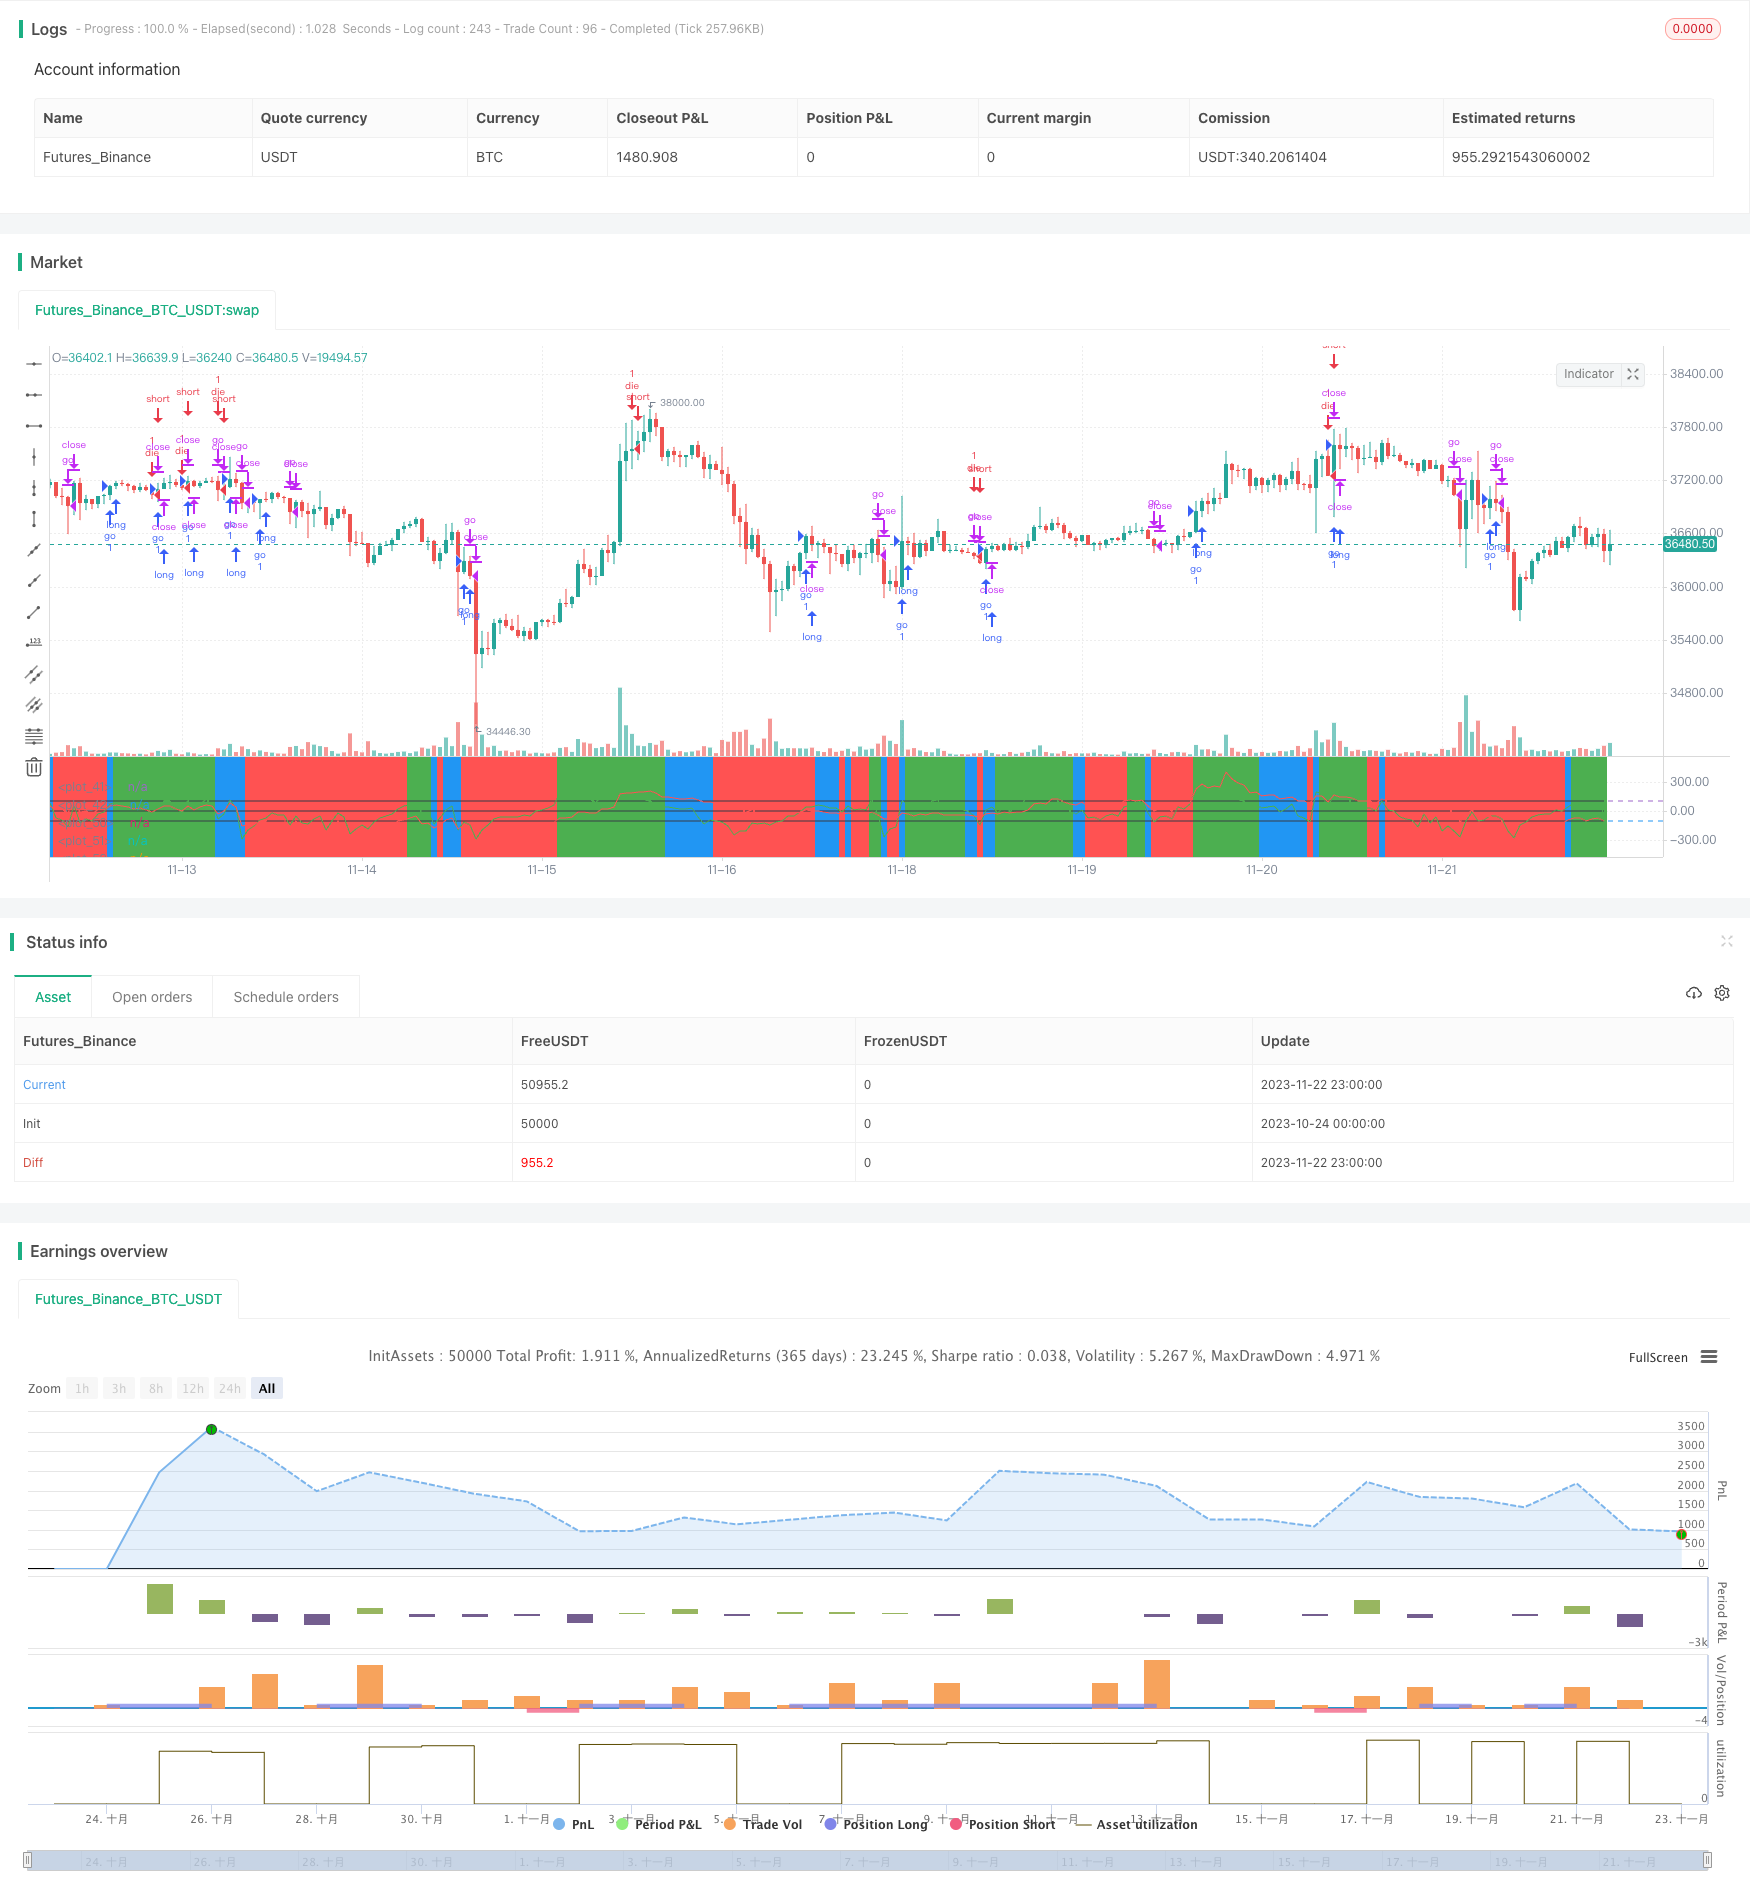
Cette stratégie est une stratégie de suivi de tendance basée sur l’indicateur CCI. Elle utilise l’indicateur CCI de deux périodes différentes pour la génération de signaux de négociation. Plus précisément, elle surveille si l’indicateur CCI d’une période plus courte fait une percée dans l’indicateur CCI d’une période plus longue et décide de faire plus ou moins selon la direction de la percée.
Principe de stratégie
La logique de cette stratégie est la suivante:
- Définition de deux indices CCI, ci1 pour 14 cycles et ci2 pour 56 cycles
- Quand ci1 dépasse ci2 vers le haut, faites plus.
- Lorsque ci1 dépasse ci2 vers le bas, vide
- Après l’émission d’un signal de transaction, le plafond de la position est déterminé par les valeurs ci1 et ci2
Voici les règles pour faire plus:
- ci1 sur le ci2, c’est-à-dire le CCI à courte période sur le CCI à longue période
- Conditions de stop-loss: ci1 < -50 et taux de variation < 0 ou ci1 inférieur à -100
Les règles de base sont les suivantes:
- ci1 sous la traverse ci2, c’est-à-dire CCI à courte période sous la traverse CCI à longue période
- Conditions de stop-loss: ci1>100 et taux de variation>0 ou ci2 sur 100
On peut voir que cette stratégie exploite la sensibilité des CCI à courte période et la stabilité des CCI à longue période pour identifier et suivre les tendances.
Avantages stratégiques
Cette stratégie présente les avantages suivants:
- L’indicateur CCI peut être utilisé pour identifier les tendances
- La conception du double CCI permet de filtrer une partie du bruit des transactions
- La combinaison d’indicateurs CCI à long terme et à court terme permet de contrôler les risques tout en suivant les tendances
- Les règles de la stratégie sont simples, claires, faciles à comprendre et à mettre en œuvre
- La configuration est plus complète, les cycles CCI et les conditions de stop loss peuvent être personnalisés
Risque stratégique
Cette stratégie comporte aussi des risques:
- L’indicateur CCI a une faible capacité de détection des mouvements de la boîte horizontale et de la secousse
- Les cycles CCI courts et longs peuvent être déviés, entraînant des signaux de trading erronés.
- Une mauvaise configuration des conditions de stop-loss peut entraîner des pertes plus importantes
- Une mauvaise configuration des paramètres peut également avoir un impact significatif sur les gains stratégiques.
Les solutions pour faire face aux risques:
- Il est possible d’évaluer les tendances en fonction d’autres indicateurs et d’éviter de négocier dans des conditions de choc.
- Augmentation des conditions de filtrage pour éviter les signaux erronés induits par les déviations de CCI sur de longues périodes
- Optimiser et tester différentes conditions de stop loss
- Sélection de la combinaison appropriée de paramètres par rétroanalyse et optimisation des paramètres
Orientation de l’optimisation de la stratégie
La stratégie peut être optimisée de différentes manières:
- Ajouter d’autres critères pour créer un système de trading plus SYSTEM
- Test de la différence de rendement entre les jours de semaine et les sessions
- La recherche de meilleurs paramètres combinée à l’apprentissage automatique
- Ajustement des paramètres en fonction des caractéristiques des différentes variétés
- Optimiser les conditions d’ouverture et de placement des positions
Résumer
Cette stratégie est une stratégie de suivi de tendance simple basée sur la rupture de l’indicateur CCI à long terme. Elle permet d’identifier efficacement la direction de la tendance et de suivre la tendance.
/*backtest
start: 2023-10-24 00:00:00
end: 2023-11-23 00:00:00
period: 1h
basePeriod: 15m
exchanges: [{"eid":"Futures_Binance","currency":"BTC_USDT"}]
*/

//@version=3
strategy(title="my work",calc_on_order_fills=true,currency=currency.USD, default_qty_type=strategy.percent_of_equity,commission_type=strategy.commission.percent)


source = close
shortlength=input(14)
longlength=input(56)
aa=input(2)
Ss=input(75)

//Cci part
ci1=cci(source,shortlength)   //4시간봉의 기본 cci
ci2=cci(source,longlength)   //4시간봉에서 12시봉의 cci 무빙측정

//오린간 선생님의 WT + ichimoku
len = input(10)
lenTurn = input(9)
lenStd = input(26)

wtm_e(so, l) =>
    esa = ema(so, l)
    d = ema(abs(so - esa), l)
    ci = (so - esa) / (0.015 * d)
    ema(ci, l*2+1)

alh(len) => avg(lowest(len), highest(len))
alh_src(src, len) => avg(lowest(src, len), highest(src, len))

wt = wtm_e(close,len)
turn = alh_src(wt, lenTurn)
std = alh_src(wt, lenStd)

cnt = 0
if wt > turn
    cnt:=cnt+1
if wt > std
    cnt:=cnt+1


//100,-100선
h0 = hline(100)
h1 = hline(-100)

//plot(ci,color=green)
// plot(k,color=green)
// plot(d,color=red)
plot(ci1,color=green)
plot(ci2,color=red)

plot(0,color=black)
plot(100,color=black)
plot(-100,color=black)

fill(h0,h1,color=purple,transp=95)

bgcolor(cnt==0 ? red : cnt==1 ? blue : cnt == 2 ? green : na, transp = Ss)

//기간조정

Fromday = input(defval=1, title="from day", minval=1, maxval=31)
FromMonth = input(defval=1, title="from month", minval=1, maxval=12)
FromYr = input(defval=2019, title="from yr", minval=1970)

Today = input(defval=13, title="to day", minval=1, maxval=31)
ToMonth = input(defval=12, title="to month", minval=1, maxval=12)
ToYr = input(defval=2019, title="to yr", minval=1970)

startDate = timestamp(FromYr, FromMonth, Fromday, 00, 00)
finishDate = timestamp(ToYr, ToMonth, Today, 00, 00)
Time_cond = true


/////롱

if  crossover(ci1,ci2) and change(ci2)>0 and Time_cond
    strategy.entry("go", strategy.long, comment="go")

strategy.close("go", (ci2<0 and ci1 <-50 and change(ci1)<0) or (crossunder(ci1,-100) and strategy.openprofit<0) and change(cnt)<0)


/////숏

if  (crossunder(ci1,ci2) and change(ci2)<0 and falling(ci1,aa)) and Time_cond
    strategy.entry("die", strategy.short, comment="die")

strategy.close("die", (ci2>0 and ci1 > 100 and change(ci1)>0) or (crossover(ci2,100) and strategy.openprofit<0) and change(cnt)>0)