Stratégie de trading quantitative des trois mousquetaires à moyenne mobile
Résumé: Cette stratégie est une stratégie d’analyse technique typique qui utilise plusieurs indicateurs de courbe courante, les EMA, ainsi que des indicateurs auxiliaires tels que le RSI, le MACD et le PSR, pour créer des règles d’entrée et de stop-loss en utilisant une combinaison de différentes configurations de courbe courante et de signaux d’indicateurs.
Principe de la stratégie: le cœur de la stratégie est la moyenne des 5, 9 et 21 jours. Lorsque la courte moyenne périodique est en hausse sur la moyenne de la longue période, et que la courte moyenne périodique est en baisse sur la moyenne de la longue période. En outre, la combinaison de l’indicateur RSI pour juger de la survente et de la survente, l’indicateur MACD pour déterminer la tendance, l’indicateur PSR pour identifier la résistance au support pour un commerce combiné.
L’analyse des avantages stratégiques:
- L’indicateur de la ligne moyenne est clair et intuitif, il est facile de juger de la direction de la tendance.
- Le RSI est efficace pour identifier les sur-achats et les sur-vente, le MACD pour déterminer les tendances à court et à long terme, le PSR pour trouver les prix clés et les combinaisons d’indicateurs complémentaires.
- Une grande flexibilité dans le réglage des règles de jeu et des paramètres.
- Il existe de nombreuses combinaisons d’indicateurs et de paramètres qui peuvent être optimisés et adaptés au marché.
Analyse des risques:
- Les opérations à courte période sont difficiles à maîtriser, et il y a un risque de manquer une inversion.
- Un paramètre mal réglé peut entraîner trop de faux signaux ou des signaux manquants.
- Les indicateurs purement techniques sont facilement exploités par les organismes d’arbitrage et entraînent des pertes.
- Les tremblements de terre sont très fréquents et peuvent causer des dégâts importants.
Comment réagir:
- Il est important de bien saisir les tendances de la ligne longue et d’éviter les opérations de la ligne courte à l’opposé.
- Optimiser les combinaisons de paramètres, définir les arrêts de perte et contrôler les risques.
- Attention aux possibilités de reboisement et de rebond à basse vitesse.
Les directions d’optimisation
- Ajustez les paramètres de la moyenne pour tester la combinaison optimale.
- Ajout d’autres indicateurs auxiliaires pour filtrer les signaux.
- Augmenter la probabilité de jugement des indicateurs de l’apprentissage automatique
- La précision des signaux est améliorée en fonction de la variation du volume des transactions.
- Il a ajouté: “Nous avons besoin d’une stratégie d’arrêt des pertes supplémentaire pour prévenir l’expansion des pertes”.
Résumé: La stratégie intègre plusieurs signaux d’indicateurs auxiliaires, exploite les avantages de l’indicateur de la moyenne et exploite les opportunités de vente à bas prix. L’efficacité de la stratégie peut être continuellement améliorée par l’optimisation des paramètres et la combinaison des indicateurs, mais il faut un contrôle modéré de la fréquence et des risques des opérations pour éviter que des pertes uniques n’affectent trop le bénéfice global.
||
Overview: This strategy is a typical technical analysis strategy that utilizes several common moving average indicators like EMA and auxiliary indicators like RSI, MACD, PSR to form entry and stop loss rules for finding low buy high sell opportunities.
Principle: The core of this strategy is the 5, 9, 21 day moving averages. When the short period MA crosses over the long period one, it signals an uptrend; when the short period MA crosses below the long period one, it signals a downtrend. In addition, RSI is used to determine overbought and oversold levels, MACD to judge the trend, PSR to identify support and resistance for combo trading. The background color shows market sentiment to assist trend judgment. The parameters are customizable for configuring entry rules.
Advantages:
- MA indicators give clear trend direction.
- RSI effectively spots overbought/oversold levels, MACD judges short-long trend, PSR finds key price levels. The indicators are complementary.
- Flexible entry rules and parameter settings.
- Many optimizable indicators and parameter combinations adaptable to varying market conditions.
Risks:
- Short-term operations may fail to capture major trend and miss reversals.
- Improper parameter configuration can lead to too many false signals or missing good signals.
- Pure technical indicators are susceptible to manipulation by arbitrageurs causing losses.
- Prone to being stopped out in high volatile markets.
Solutions:
- Capture mid-long term trend appropriately to avoid trading against major trend.
- Optimize parameters, use stop loss to control risks.
- Watch out the possibilities of pullback from highs and bounce from lows.
Optimization:
- Fine tune MA parameters for best combo.
- Add more indicators to filter signals.
- Increase machine learning metrics for probability estimate.
- Combine volume changes to enhance signal accuracy.
- Add stop loss to restrict loss expansion.
Summary: This strategy integrates multiple auxiliary signals, leverages the strength of MA indicators to identify short-term low buy high sell chances. Parameters and indicators combinations may be optimized continuously to improve strategy efficacy, but operation frequency and risks should be moderated to prevent oversized single trade loss from eroding overall profitability.
[/trans]
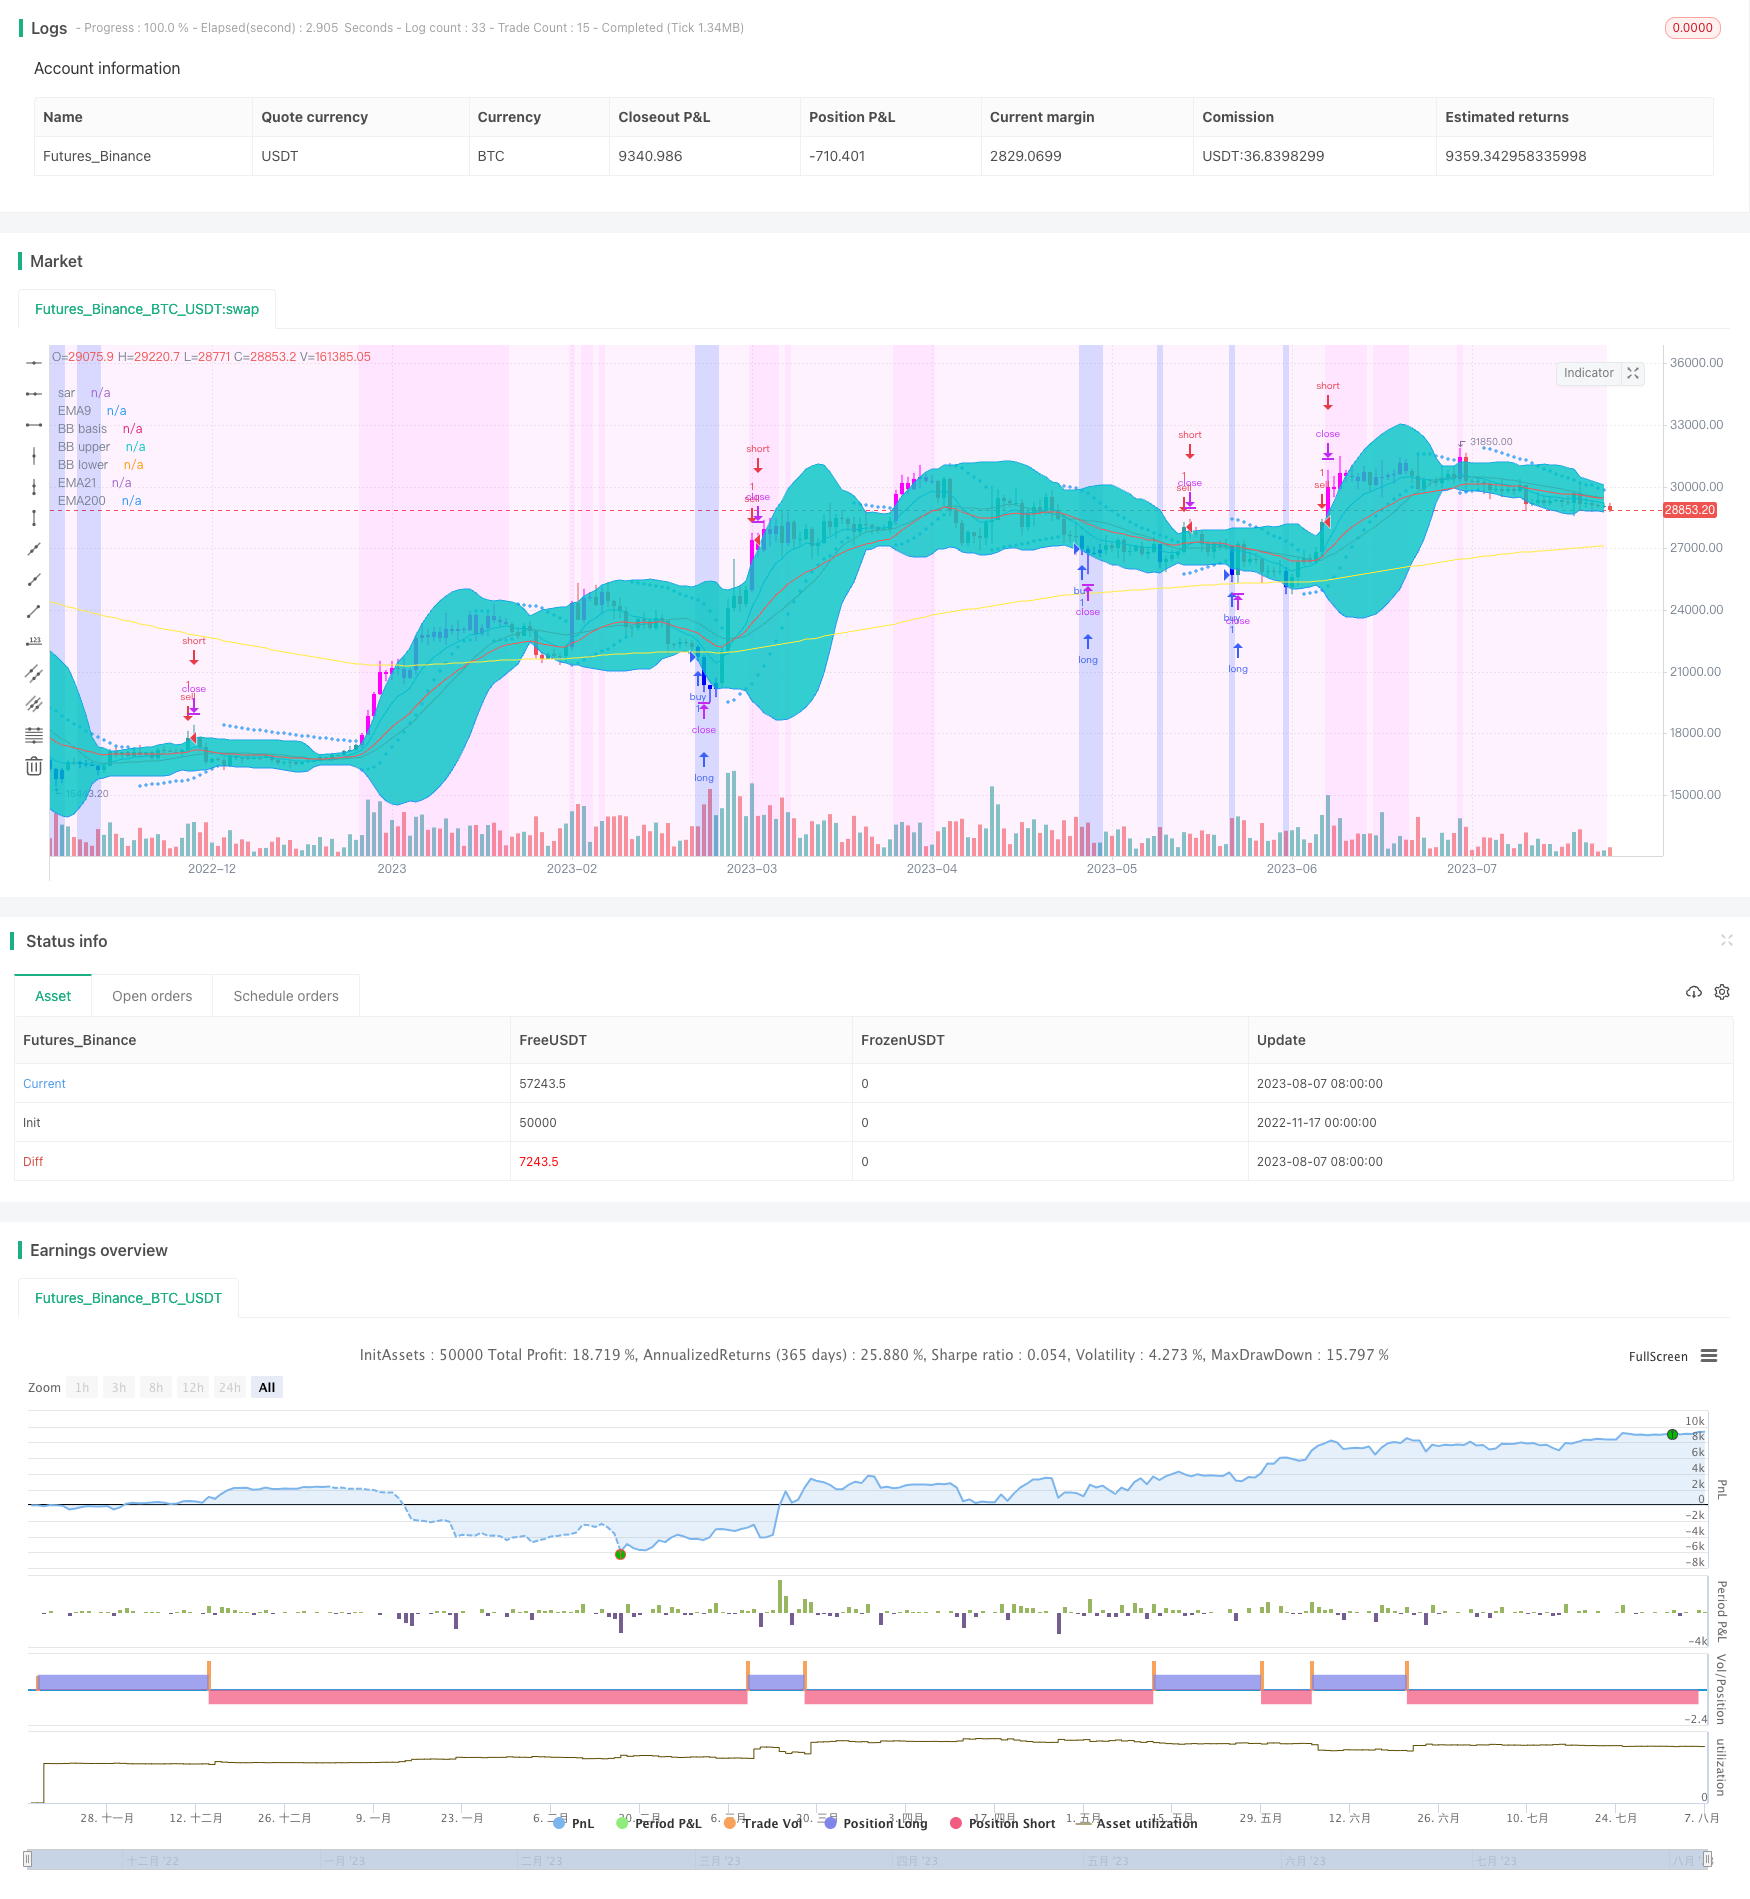
/*backtest
start: 2022-11-17 00:00:00
end: 2023-08-08 00:00:00
period: 1d
basePeriod: 1h
exchanges: [{"eid":"Futures_Binance","currency":"BTC_USDT"}]
*/

//@version=3
strategy("f.society v7", title="f.society v7", overlay=true)
//@Author: rick#1414
// -----------------------------------------------------
// f.society : Pone 3EMA: 5, 9, 21, 50, 100, 200, SAR,
// velas azules en sobreventa y velas moradas sobre compra
// SAR 0.02, 0.02, 0.2 , Bandas de Bollinger
// estrategia de compra y venta con rsi, macd o psr
// color de fondo: ema, rsi (color azul sobreventa 35, 25 (mas intenso))
// -----------------------------------------------------
// Como agregar a Trading view:
// 1 Cerrar todos los otros indicadores antes de añadirlo
// 2. Ir a la página de inicio TradingView.com
// 3. En la parte inferior, haga clic en Editor Pine // ver imagen: // https://cdn.discordapp.com/attachments/407267549047422976/407393815112974336/unknown.png
// 4. borrar todo el texo y reemplazar con todo el contenido de este archivo
// 5. Pulse el botón "Añadir a trazar" (Add to graph)
// -----------------------------------------------------
// revisar opciones de on y off segun indicadores deseados
// https://cdn.discordapp.com/attachments/405885820114042883/412115277883506700/unknown.png
// se puede cambiar la estrategia desde este menu desplegable para señales buy/sell

// Options
estrategia = input(defval="rsi", title = "Strategy", options=["ema","rsi","macd","psr","off","BB","ema5"])
in_bkcolor = input(defval="rsi", title = "background color", options=["ema","rsi","macd","psr","off","exchange","BB","ema5"])
e5 = input(title="Show ema5?", type=bool, defval=false)
e9 = input(title="Show ema9?", type=bool, defval=true)
e21 = input(title="Show ema21?", type=bool, defval=true)
e50 = input(title="Show ema50?", type=bool, defval=false)
e100 = input(title="Show ema100?", type=bool, defval=false)
e200 = input(title="Show ema200", type=bool, defval=true)
in_rsi = input(title="Color oversold and overbought bars?", type=bool, defval=true)
in_sar = input(title="Show Parabolic Sar", type=bool, defval=true)
in_bb = input(title="Show Bollinger Bands?", type=bool, defval=true)
sd = input(false, title="Show Daily Pivots?")
linew = input(1, title="linewidth", minval=0)
sarw = input(1, title="sar points width", minval=0)
ovs = input(40, title="oversold rsi", minval=0)
ovb = input(65, title="overbought rsi", minval=0)


//pf = input(false,title="Show Filtered Pivots")
pf=false

// 3 ema
src = close // input(close, title="Source")
//len9 = input(9, minval=1, title="ema9 Length")
//len21 = input(21, minval=1, title="ema21 Length")
//len200 = input(200, minval=1, title="ema200 Length")
len5=5
len9=9
len21=21
len50=50
len100=100
len200=200
ema5 = ema(src, len5)
ema9 = ema(src, len9)
ema21 = ema(src, len21)
ema50= ema(src, len50)
ema100 = ema(src, len100)
ema200 = ema(src, len200)
plot(e5? ema5 : na, title="EMA5", linewidth=linew, color=purple)
plot(e9? ema9 : na, title="EMA9", linewidth=linew, color=blue)
plot(e21? ema21 : na, title="EMA21", linewidth=linew, color=red)
plot(e50? ema50 : na, title="EMA50", linewidth=linew, color=green)
plot(e100? ema100 : na, title="EMA100", linewidth=linew, color=lime)
plot(e200? ema200 : na, title="EMA200", linewidth=linew, color=yellow)

// RSI Color
//lenR = input(14, minval=1, title="RSI Length")
lenR=14
//up = rma(max(change(src), 0), lenR)
//down = rma(-min(change(src), 0), lenR)
//vrsi = down == 0 ? 100 : up == 0 ? 0 : 100 - (100 / (1 + up / down))
vrsi=rsi(close,lenR)
//plot(vrsi,title="vrsi")
oversold = vrsi < ovs
overbought = vrsi > ovb
barcolor(in_rsi? oversold? #0000FF : overbought? #ff00ff:na : na)

// SAR
plot(in_sar? sar(0.02, 0.02, 0.2): na, style=cross, linewidth=sarw, color=blue, title="sar")

// BB
//length = input(20, title="Bollinger length", minval=1)
length=20
//mult = input(2.0, title="Bollinger stdDev", minval=0.001, maxval=50)
mult=2.0
basis = sma(src, length)
dev = mult * stdev(src, length)
upper = basis + dev
lower = basis - dev
plot(in_bb? basis :na, color=red, linewidth=linew, title="BB basis")
p1 = plot(in_bb? upper :na, color=blue, linewidth=linew, title="BB upper")
p2 = plot(in_bb? lower :na, color=blue, linewidth=linew, title="BB lower")
fill(p1, p2)

//background
bgcolor(in_bkcolor=="exchange"? #0000FF40 : in_bkcolor=="rsi"? vrsi < (ovs-15) ? #0000FF50  : vrsi < ovs ? #0000FF30 :( vrsi < ovb ? #ff00ff10 : #ff00ff20): in_bkcolor=="ema"?(ema9>ema21?#ff00ff10  : #0000FF20):in_bkcolor=="BB"?(lower>close?#ff00ff10 : close>upper?#0000FF20:#ff00ff10): in_bkcolor=="ema5"?(ema5>ema21?#ff00ff10  : #0000FF20):na)


// Strategy
if estrategia == "ema"
    strategy.entry("buy", true, 1, when= crossover(ema9,ema21) ),
    strategy.entry("sell", false, 1, when = crossover(ema21,ema9))
else
    if estrategia =="rsi"
        strategy.entry("buy", true, 1, when= vrsi <ovs),
        strategy.entry("sell", false, 1, when = vrsi > ovb or crossover(close,upper))
    else
        if estrategia =="macd"
            [macdLine, signalLine, histLine] = macd(close, 12, 26, 9),
            //bgcolor(macdLine > signalLine ? #98c8ff : #ff8b94),
            strategy.entry("buy", true, 1, when= macdLine>=signalLine ),
            strategy.entry("sell", false, 1, when = macdLine<signalLine)
        else
            if estrategia=="psr"
                leftBars = 4 //input(4)
                rightBars = 2 //input(2)
                swh = pivothigh(leftBars, rightBars)
                swl = pivotlow(leftBars, rightBars)
                swh_cond = not na(swh)
                hprice = 0.0
                hprice := swh_cond ? swh : hprice[1]
                le = false
                le := swh_cond ? true : (le[1] and high > hprice ? false : le[1])
                if (le)
                    strategy.entry("buy", strategy.long, comment="buy", stop=hprice + syminfo.mintick)
                swl_cond = not na(swl)
                lprice = 0.0
                lprice := swl_cond ? swl : lprice[1]
                se = false
                se := swl_cond ? true : (se[1] and low < lprice ? false : se[1])
                if (se)
                    strategy.entry("sell", strategy.short, comment="sell", stop=lprice - syminfo.mintick)
            else
                if estrategia=="BB"
                    strategy.entry("buy", true, 1, when= crossover(lower,close) ),
                    strategy.entry("sell", false, 1, when = crossover(close,upper))
                else
                    if estrategia=="ema5"
                        strategy.entry("buy", true, 1, when= crossover(ema5,ema21) ),
                        strategy.entry("sell", false, 1, when = crossover(ema21,ema5))


// pivots

// Classic Pivot
pivot = (high + low + close ) / 3.0
// Filter Cr
bull= pivot > (pivot + pivot[1]) / 2 + .0025
bear= pivot < (pivot + pivot[1]) / 2 - .0025
// Classic Pivots
r1 = pf and bear ? pivot + (pivot - low) : pf and bull ? pivot + (high - low) : pivot + (pivot - low)
s1 = pf and bull ? pivot - (high - pivot) : pf and bear ? pivot - (high - low) : pivot - (high - pivot)
r2 = pf ? na : pivot + (high - low)
s2 = pf ? na : pivot - (high - low)
//Pivot Average Calculation
smaP = sma(pivot, 3)
//Daily Pivots
dtime_pivot = request.security(syminfo.tickerid, 'D', pivot[1])
dtime_pivotAvg = request.security(syminfo.tickerid, 'D', smaP[1])
dtime_r1 = request.security(syminfo.tickerid, 'D', r1[1])
dtime_s1 = request.security(syminfo.tickerid, 'D', s1[1])
dtime_r2 = request.security(syminfo.tickerid, 'D', r2[1])
dtime_s2 = request.security(syminfo.tickerid, 'D', s2[1])
offs_daily = 0
plot(sd and dtime_pivot ? dtime_pivot : na, title="Daily Pivot",style=line, color=fuchsia,linewidth=linew)
plot(sd and dtime_r1 ? dtime_r1 : na, title="Daily R1",style=line, color=#DC143C,linewidth=linew)
plot(sd and dtime_s1 ? dtime_s1 : na, title="Daily S1",style=line, color=lime,linewidth=linew)
plot(sd and dtime_r2 ? dtime_r2 : na, title="Daily R2",style=line, color=maroon,linewidth=linew)
plot(sd and dtime_s2 ? dtime_s2 : na, title="Daily S2",style=line, color=#228B22,linewidth=linew)


// References:
// get number of bars since last green bar
//plot(barssince(close >= open), linewidth=3, color=blue)
//bgcolor(close < open ? #ff8b94   : #98c8ff , transp=10)
//http://www.color-hex.com/
//   #98c8ff    light blue
//    #ff8b94   red   #b21c0e
//       #7d1d90    purple
//    #0029ff blue
//    #fffa86   yellow