
Cette stratégie est basée sur l’indicateur de la fluctuation moyenne réelle (ATR) pour concevoir un stop-loss mobile et une inversion. Elle suit le changement de prix pour trailing stop loss, c’est-à-dire pour suivre l’ajustement du stop-loss. Plus précisément, si le prix change de plus de 1%, le stop-loss se déplace en proportion fixe vers le profit.
La stratégie utilise l’indicateur ATR pour calculer la ligne de stop-loss. La formule est la suivante:
atr = multplierFactor * atr(barsBack)
longStop = hl2 - atr
shortStop = hl2 + atr
Le multipleurFactor est le coefficient d’amplification de l’ATR et le barBack est le nombre de cycles d’ATR. Plus l’ATR est élevé, plus le marché fluctue.
Le longStop et le shortStop sont calculés en fonction de la valeur ATR. Un signal de transaction est émis lorsque le prix dépasse ces deux lignes.
En outre, la stratégie introduit une variable direction pour déterminer la direction de la tendance:
direction = 1
direction := nz(direction[1], direction)
direction := direction == -1 and close > shortStopPrev ? 1 : direction == 1 and close < longStopPrev ? -1 : direction
Si la direction est 1, elle est en tendance vers le haut, et si la direction est -1, elle est en tendance vers le bas.
La ligne de perte est dessinée en différentes couleurs en fonction de la valeur de la variable de direction:
if (direction == 1)
valueToPlot := longStop
colorToPlot := color.green
else
valueToPlot := shortStop
colorToPlot := color.red
Cela permet de voir clairement la direction de la tendance actuelle et la position de la ligne de stop-loss.
Le point clé de la stratégie est l’introduction d’un mécanisme de suivi des arrêts qui permet d’ajuster les lignes de stop en temps réel en fonction de l’activité des prix.
La logique est la suivante:
strategyPercentege = (close - updatedEntryPrice) / updatedEntryPrice * 100.00
rideUpStopLoss = hasOpenTrade() and strategyPercentege > 1
if (rideUpStopLoss)
stopLossPercent := stopLossPercent + strategyPercentege - 1.0
newStopLossPrice = updatedEntryPrice + (updatedEntryPrice * stopLossPercent) / 100
stopLossPrice := max(stopLossPrice, newStopLossPrice)
updatedEntryPrice := stopLossPrice
Si la hausse du prix par rapport au prix d’entrée est supérieure à 1%, le suivi de l’ajustement de la ligne de stop-loss est effectué vers le haut. La partie de la marge d’ajustement est supérieure à 1%.
Il s’agit d’une méthode qui permet de verrouiller plus de bénéfices tout en réduisant les pertes.
Le plus grand avantage de cette stratégie par rapport aux stratégies traditionnelles de stop-loss mobiles est qu’elle permet d’ajuster la ligne de stop-loss en fonction de la dynamique des conditions du marché. Les avantages spécifiques sont les suivants:
Le mécanisme de suivi des stop-loss permet à la ligne de stop-loss de se déplacer continuellement vers les bénéfices, afin de bloquer des bénéfices plus élevés si la tendance se poursuit.
Les lignes de stop-loss fixes et mobiles sont faciles à sauter lorsque les tendances du marché changent. Les lignes de stop-loss de cette stratégie sont calculées sur la volatilité du marché et permettent de suivre raisonnablement les variations de prix et d’éviter de sauter les stop-loss lors de la liquidation.
La stratégie est entièrement basée sur l’indicateur et n’a pas de logique de jugement de tendance complexe. La négociation automatisée peut être réalisée très simplement.
Les paramètres tels que le cycle ATR, le coefficient d’amplification et le stop loss peuvent être personnalisés et optimisés pour différents types de paramètres, ce qui rend la stratégie plus universelle.
Bien que cette stratégie présente de nombreux avantages, les risques suivants doivent être pris en compte:
La stratégie ne détermine pas la logique de la fin d’une tendance.
Si le paramètre de cycle ATR est trop court, la ligne d’arrêt est trop sensible et peut être déclenchée par une fréquence de tremblement de terre.
La stratégie ne prend pas en compte les points de classification comme points de support de stop loss. Ainsi, les courts rebonds peuvent également être jetés sur le marché.
Les risques mentionnés ci-dessus peuvent être optimisés dans les domaines suivants:
Le retour de la tendance peut être estimé à l’avance grâce à l’indicateur de fléchissement de la tendance.
Tests d’optimisation des paramètres pour sélectionner la combinaison optimale de paramètres
Élargissement du périmètre de stop-loss à proximité de certains supports
Il y a encore de la place pour optimiser cette stratégie:
On peut déterminer la probabilité d’un renversement de tendance en identifiant certaines formes typiques de la ligne K, telles que le dos, l’étoile filante, etc. Cela évite le risque de poursuivre la chute.
Les paramètres tels que le cycle ATR, le coefficient d’amplification et d’autres paramètres peuvent également être modifiés de manière dynamique, en utilisant un cycle ATR plus long et une zone de coupe plus large dans les marchés très volatils.
Les modèles d’apprentissage en profondeur (lstm, rnn, etc.) permettent de prédire la fourchette de prix éventuelle sur le marché de l’après-vente et d’ajuster dynamiquement la distance de stop-loss.
La stratégie overall utilise l’indicateur ATR pour concevoir des lignes de stop mobiles et introduit un mécanisme de suivi des stop, permettant d’ajuster les stop en temps réel en fonction de l’évolution des conditions de marché. Cela permet une plus grande localisation des bénéfices tout en réduisant les risques. Grâce à une optimisation supplémentaire, la stratégie peut être plus adaptée à diverses situations du marché et devenir une stratégie de trading plus adaptable.
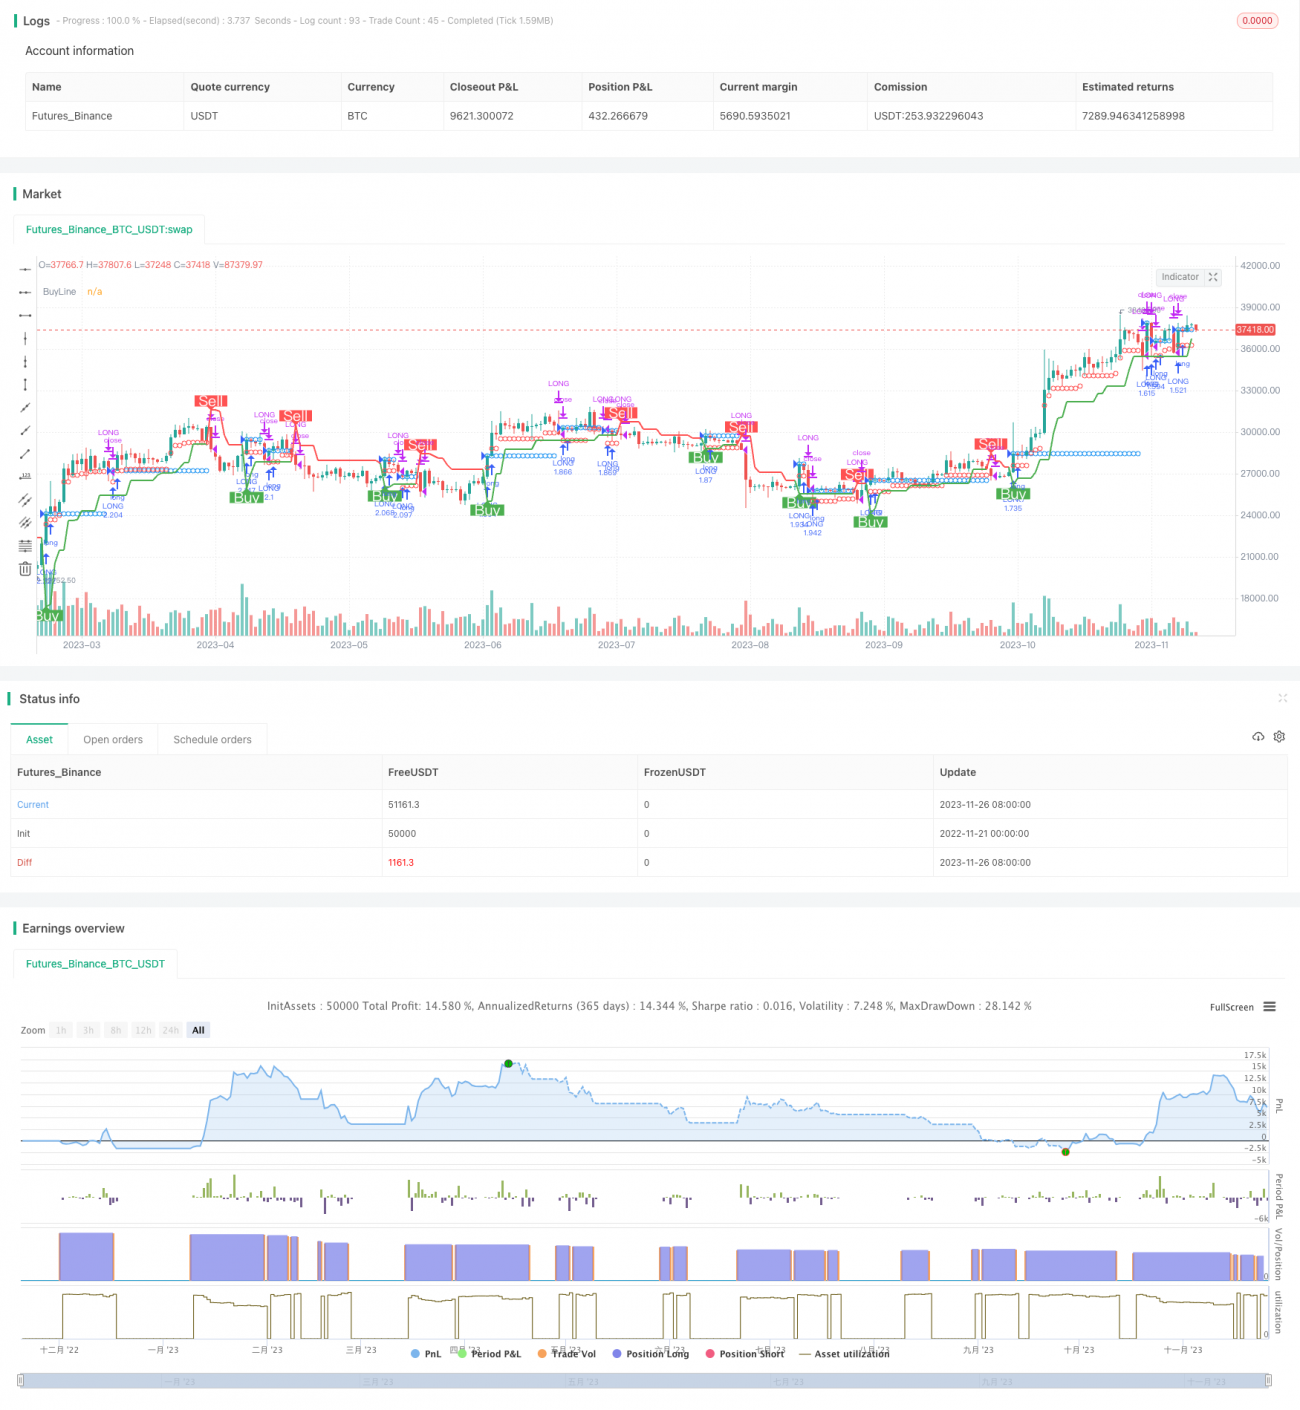
/*backtest
start: 2022-11-21 00:00:00
end: 2023-11-27 00:00:00
period: 1d
basePeriod: 1h
exchanges: [{"eid":"Futures_Binance","currency":"BTC_USDT"}]
*/
//@version=4
//
// ▒▒▒▒▒▒▒▒▒▒▒▒▒▒▒▒▒▒▒▒▒▒▒▒▒▒▒▒▒▒▒▒▒▒▒▒▒▒▒▒▒▒▒▒▒▒▒▒▒▒▒▒▒▒▒▒▒▒▒▒▒▒▒▒▒▒▒▒▒▒▒▒▒▒▒▒▒▒▒▒▒▒▒▒▒▒▒▒▒▒▒▒▒▒▒▒▒▒▒▒▒▒▒▒▒▒▒▒▒▒▒▒▒▒
// -----------------------------------------------------------------------------
// Copyright 2019 Mauricio Pimenta | exit490
// SuperTrend with Trailing Stop Loss script may be freely distributed under the MIT license.
//
// Permission is hereby granted, free of charge,
// to any person obtaining a copy of this software and associated documentation files (the "Software"),
// to deal in the Software without restriction, including without limitation the rights to use, copy, modify, merge,
// publish, distribute, sublicense, and/or sell copies of the Software, and to permit persons to whom the Software is furnished to do so,
// subject to the following conditions:
//
// The above copyright notice and this permission notice shall be included in all copies or substantial portions of the Software.
//
// THE SOFTWARE IS PROVIDED "AS IS", WITHOUT WARRANTY OF ANY KIND,
// EXPRESS OR IMPLIED, INCLUDING BUT NOT LIMITED TO THE WARRANTIES OF MERCHANTABILITY,
// FITNESS FOR A PARTICULAR PURPOSE AND NONINFRINGEMENT. IN NO EVENT SHALL THE AUTHORS OR COPYRIGHT HOLDERS BE LIABLE FOR ANY CLAIM,
// DAMAGES OR OTHER LIABILITY, WHETHER IN AN ACTION OF CONTRACT, TORT OR OTHERWISE, ARISING FROM,
// OUT OF OR IN CONNECTION WITH THE SOFTWARE OR THE USE OR OTHER DEALINGS IN THE SOFTWARE.
//
// -----------------------------------------------------------------------------
//
// Authors: @exit490
// Revision: v1.0.0
// Date: 5-Aug-2019
//
// Description
// ===========
// SuperTrend is a moving stop and reversal line based on the volatility (ATR).
// The strategy will ride up your stop loss when price moviment 1%.
// The strategy will close your operation when the market price crossed the stop loss.
// The strategy will close operation when the line based on the volatility will crossed
//
// The strategy has the following parameters:
//
// INITIAL STOP LOSS - Where can isert the value to first stop.
// POSITION TYPE - Where can to select trade position.
// ATR PERIOD - To select number of bars back to execute calculation
// ATR MULTPLIER - To add a multplier factor on volatility
// BACKTEST PERIOD - To select range.
//
// -----------------------------------------------------------------------------
// Disclaimer:
// 1. I am not licensed financial advisors or broker dealers. I do not tell you
// when or what to buy or sell. I developed this software which enables you
// execute manual or automated trades multplierFactoriplierFactoriple trades using TradingView. The
// software allows you to set the criteria you want for entering and exiting
// trades.
// 2. Do not trade with money you cannot afford to lose.
// 3. I do not guarantee consistent profits or that anyone can make money with no
// effort. And I am not selling the holy grail.
// 4. Every system can have winning and losing streaks.
// 5. Money management plays a large role in the results of your trading. For
// example: lot size, account size, broker leverage, and broker margin call
// rules all have an effect on results. Also, your Take Profit and Stop Loss
// settings for individual pair trades and for overall account equity have a
// major impact on results. If you are new to trading and do not understand
// these items, then I recommend you seek education materials to further your
// knowledge.
//
// YOU NEED TO FIND AND USE THE TRADING SYSTEM THAT WORKS BEST FOR YOU AND YOUR
// TRADING TOLERANCE.
//
// I HAVE PROVIDED NOTHING MORE THAN A TOOL WITH OPTIONS FOR YOU TO TRADE WITH THIS PROGRAM ON TRADINGVIEW.
//
// I accept suggestions to improve the script.
// If you encounter any problems I will be happy to share with me.
// -----------------------------------------------------------------------------
//
// ▒▒▒▒▒▒▒▒▒▒▒▒▒▒▒▒▒▒▒▒▒▒▒▒▒▒▒▒▒▒▒▒▒▒▒▒▒▒▒▒▒▒▒▒▒▒▒▒▒▒▒▒▒▒▒▒▒▒▒▒▒▒▒▒▒▒▒▒▒▒▒▒▒▒▒▒▒▒▒▒▒▒▒▒▒▒▒▒▒▒▒▒▒▒▒▒▒▒▒▒▒▒▒▒▒▒▒▒▒▒▒▒▒▒ //
strategy(title = "SUPERTREND ATR WITH TRAILING STOP LOSS",
shorttitle = "SUPERTREND ATR WITH TSL",
overlay = true,
precision = 8,
calc_on_order_fills = true,
calc_on_every_tick = true,
backtest_fill_limits_assumption = 0,
default_qty_type = strategy.percent_of_equity,
default_qty_value = 100,
initial_capital = 1000,
currency = currency.USD,
linktoseries = true)
//
// ▒▒▒▒▒▒▒▒▒▒▒▒▒▒▒▒▒▒▒▒▒▒▒▒▒▒▒▒▒▒▒▒▒▒▒▒▒▒▒▒▒▒▒▒▒▒▒▒▒▒▒▒▒▒▒▒▒▒▒▒▒▒▒▒▒▒▒▒▒▒▒▒▒▒▒▒▒▒▒▒▒▒▒▒▒▒▒▒▒▒▒▒▒▒▒▒▒▒▒▒▒▒▒▒▒▒▒▒▒▒▒▒▒▒ //
// === BACKTEST RANGE ===
backTestSectionFrom = input(title = "═══════════════ FROM ═══════════════", defval = true, type = input.bool)
FromMonth = input(defval = 1, title = "Month", minval = 1)
FromDay = input(defval = 1, title = "Day", minval = 1)
FromYear = input(defval = 2019, title = "Year", minval = 2014)
backTestSectionTo = input(title = "════════════════ TO ════════════════", defval = true, type = input.bool)
ToMonth = input(defval = 31, title = "Month", minval = 1)
ToDay = input(defval = 12, title = "Day", minval = 1)
ToYear = input(defval = 9999, title = "Year", minval = 2014)
backTestPeriod() => (time > timestamp(FromYear, FromMonth, FromDay, 00, 00)) and (time < timestamp(ToYear, ToMonth, ToDay, 23, 59))
//
// ▒▒▒▒▒▒▒▒▒▒▒▒▒▒▒▒▒▒▒▒▒▒▒▒▒▒▒▒▒▒▒▒▒▒▒▒▒▒▒▒▒▒▒▒▒▒▒▒▒▒▒▒▒▒▒▒▒▒▒▒▒▒▒▒▒▒▒▒▒▒▒▒▒▒▒▒▒▒▒▒▒▒▒▒▒▒▒▒▒▒▒▒▒▒▒▒▒▒▒▒▒▒▒▒▒▒▒▒▒▒▒▒▒▒ //
parameterSection = input(title = "═════════════ STRATEGY ═════════════", defval = true, type = input.bool)
// === INPUT TO SELECT POSITION ===
positionType = input(defval="LONG", title="Position Type", options=["LONG", "SHORT"])
// === INPUT TO SELECT INITIAL STOP LOSS
initialStopLossPercent = input(defval = 3.0, minval = 0.0, title="Initial Stop Loss")
// === INPUT TO SELECT BARS BACK
barsBack = input(title="ATR Period", defval=1)
// === INPUT TO SELECT MULTPLIER FACTOR
multplierFactor = input(title="ATR multplierFactoriplier", step=0.1, defval=3.0)
//
// ▒▒▒▒▒▒▒▒▒▒▒▒▒▒▒▒▒▒▒▒▒▒▒▒▒▒▒▒▒▒▒▒▒▒▒▒▒▒▒▒▒▒▒▒▒▒▒▒▒▒▒▒▒▒▒▒▒▒▒▒▒▒▒▒▒▒▒▒▒▒▒▒▒▒▒▒▒▒▒▒▒▒▒▒▒▒▒▒▒▒▒▒▒▒▒▒▒▒▒▒▒▒▒▒▒▒▒▒▒▒▒▒▒▒ //
// LOGIC TO FIND DIRECTION WHEN THERE IS TREND CHANGE ACCORDING VOLATILITY
atr = multplierFactor * atr(barsBack)
longStop = hl2 - atr
longStopPrev = nz(longStop[1], longStop)
longStop := close[1] > longStopPrev ? max(longStop, longStopPrev) : longStop
shortStop = hl2 + atr
shortStopPrev = nz(shortStop[1], shortStop)
shortStop := close[1] < shortStopPrev ? min(shortStop, shortStopPrev) : shortStop
direction = 1
direction := nz(direction[1], direction)
direction := direction == -1 and close > shortStopPrev ? 1 : direction == 1 and close < longStopPrev ? -1 : direction
longColor = color.blue
shortColor = color.blue
var valueToPlot = 0.0
var colorToPlot = color.white
if (direction == 1)
valueToPlot := longStop
colorToPlot := color.green
else
valueToPlot := shortStop
colorToPlot := color.red
//
// ▒▒▒▒▒▒▒▒▒▒▒▒▒▒▒▒▒▒▒▒▒▒▒▒▒▒▒▒▒▒▒▒▒▒▒▒▒▒▒▒▒▒▒▒▒▒▒▒▒▒▒▒▒▒▒▒▒▒▒▒▒▒▒▒▒▒▒▒▒▒▒▒▒▒▒▒▒▒▒▒▒▒▒▒▒▒▒▒▒▒▒▒▒▒▒▒▒▒▒▒▒▒▒▒▒▒▒▒▒▒▒▒▒▒ //
//
// === GLOBAL VARIABLES AND FUNCTIONS TO STORE IMPORTANT CONDITIONALS TO TRAILING STOP
hasEntryLongConditional() => direction == 1
hasCloseLongConditional() => direction == -1
hasEntryShortConditional() => direction == -1
hasCloseShortConditional() => direction == 1
stopLossPercent = positionType == "LONG" ? initialStopLossPercent * -1 : initialStopLossPercent
var entryPrice = 0.0
var updatedEntryPrice = 0.0
var stopLossPrice = 0.0
hasOpenTrade() => strategy.opentrades != 0
notHasOpenTrade() => strategy.opentrades == 0
strategyClose() =>
if positionType == "LONG"
strategy.close("LONG", when=true)
else
strategy.close("SHORT", when=true)
strategyOpen() =>
if positionType == "LONG"
strategy.entry("LONG", strategy.long, when=true)
else
strategy.entry("SHORT", strategy.short, when=true)
isLong() => positionType == "LONG" ? true : false
isShort() => positionType == "SHORT" ? true : false
//
// ▒▒▒▒▒▒▒▒▒▒▒▒▒▒▒▒▒▒▒▒▒▒▒▒▒▒▒▒▒▒▒▒▒▒▒▒▒▒▒▒▒▒▒▒▒▒▒▒▒▒▒▒▒▒▒▒▒▒▒▒▒▒▒▒▒▒▒▒▒▒▒▒▒▒▒▒▒▒▒▒▒▒▒▒▒▒▒▒▒▒▒▒▒▒▒▒▒▒▒▒▒▒▒▒▒▒▒▒▒▒▒▒▒▒ //
//
// === LOGIC TO TRAILING STOP IN LONG POSITION
if (isLong() and backTestPeriod())
crossedStopLoss = close <= stopLossPrice
terminateOperation = hasOpenTrade() and (crossedStopLoss or hasCloseLongConditional())
if (terminateOperation)
entryPrice := 0.0
updatedEntryPrice := entryPrice
stopLossPrice := 0.0
strategyClose()
startOperation = notHasOpenTrade() and hasEntryLongConditional()
if(startOperation)
entryPrice := close
updatedEntryPrice := entryPrice
stopLossPrice := entryPrice + (entryPrice * stopLossPercent) / 100
strategyOpen()
strategyPercentege = (close - updatedEntryPrice) / updatedEntryPrice * 100.00
rideUpStopLoss = hasOpenTrade() and strategyPercentege > 1
if (isLong() and rideUpStopLoss)
stopLossPercent := stopLossPercent + strategyPercentege - 1.0
newStopLossPrice = updatedEntryPrice + (updatedEntryPrice * stopLossPercent) / 100
stopLossPrice := max(stopLossPrice, newStopLossPrice)
updatedEntryPrice := stopLossPrice
//
// ▒▒▒▒▒▒▒▒▒▒▒▒▒▒▒▒▒▒▒▒▒▒▒▒▒▒▒▒▒▒▒▒▒▒▒▒▒▒▒▒▒▒▒▒▒▒▒▒▒▒▒▒▒▒▒▒▒▒▒▒▒▒▒▒▒▒▒▒▒▒▒▒▒▒▒▒▒▒▒▒▒▒▒▒▒▒▒▒▒▒▒▒▒▒▒▒▒▒▒▒▒▒▒▒▒▒▒▒▒▒▒▒▒▒ //
//
// === LOGIC TO TRAILING STOP IN SHORT POSITION
if (isShort() and backTestPeriod())
crossedStopLoss = close >= stopLossPrice
terminateOperation = hasOpenTrade() and (crossedStopLoss or hasCloseShortConditional())
if (terminateOperation)
entryPrice := 0.0
updatedEntryPrice := entryPrice
stopLossPrice := 0.0
strategyClose()
startOperation = notHasOpenTrade() and hasEntryShortConditional()
if(startOperation)
entryPrice := close
updatedEntryPrice := entryPrice
stopLossPrice := entryPrice + (entryPrice * stopLossPercent) / 100
strategyOpen()
strategyPercentege = (close - updatedEntryPrice) / updatedEntryPrice * 100.00
rideDownStopLoss = hasOpenTrade() and strategyPercentege < -1
if (rideDownStopLoss)
stopLossPercent := stopLossPercent + strategyPercentege + 1.0
newStopLossPrice = updatedEntryPrice + (updatedEntryPrice * stopLossPercent) / 100
stopLossPrice := min(stopLossPrice, newStopLossPrice)
updatedEntryPrice := stopLossPrice
//
// ▒▒▒▒▒▒▒▒▒▒▒▒▒▒▒▒▒▒▒▒▒▒▒▒▒▒▒▒▒▒▒▒▒▒▒▒▒▒▒▒▒▒▒▒▒▒▒▒▒▒▒▒▒▒▒▒▒▒▒▒▒▒▒▒▒▒▒▒▒▒▒▒▒▒▒▒▒▒▒▒▒▒▒▒▒▒▒▒▒▒▒▒▒▒▒▒▒▒▒▒▒▒▒▒▒▒▒▒▒▒▒▒▒▒
//
// === DRAWING SHAPES
entryPricePlotConditinal = entryPrice == 0.0 ? na : entryPrice
trailingStopLossPlotConditional = stopLossPrice == 0.0 ? na : stopLossPrice
plotshape(entryPricePlotConditinal, title= "Entry Price", color=color.blue, style=shape.circle, location=location.absolute, size=size.tiny)
plotshape(trailingStopLossPlotConditional, title= "Stop Loss", color=color.red, style=shape.circle, location=location.absolute, size=size.tiny)
plot(valueToPlot == 0.0 ? na : valueToPlot, title="BuyLine", linewidth=2, color=colorToPlot)
plotshape(direction == 1 and direction[1] == -1 ? longStop : na, title="Buy", style=shape.labelup, location=location.absolute, size=size.normal, text="Buy", transp=0, textcolor = color.white, color=color.green, transp=0)
plotshape(direction == -1 and direction[1] == 1 ? shortStop : na, title="Sell", style=shape.labeldown, location=location.absolute, size=size.normal, text="Sell", transp=0, textcolor = color.white, color=color.red, transp=0)
alertcondition(direction == 1 and direction[1] == -1 ? longStop : na, title="Buy", message="Buy!")
alertcondition(direction == -1 and direction[1] == 1 ? shortStop : na, title="Sell", message="Sell!")