Stratégie de détrending basée sur l'indicateur de pourcentage des bandes de Bollinger

1
Follow
1779
Followers
Aperçu
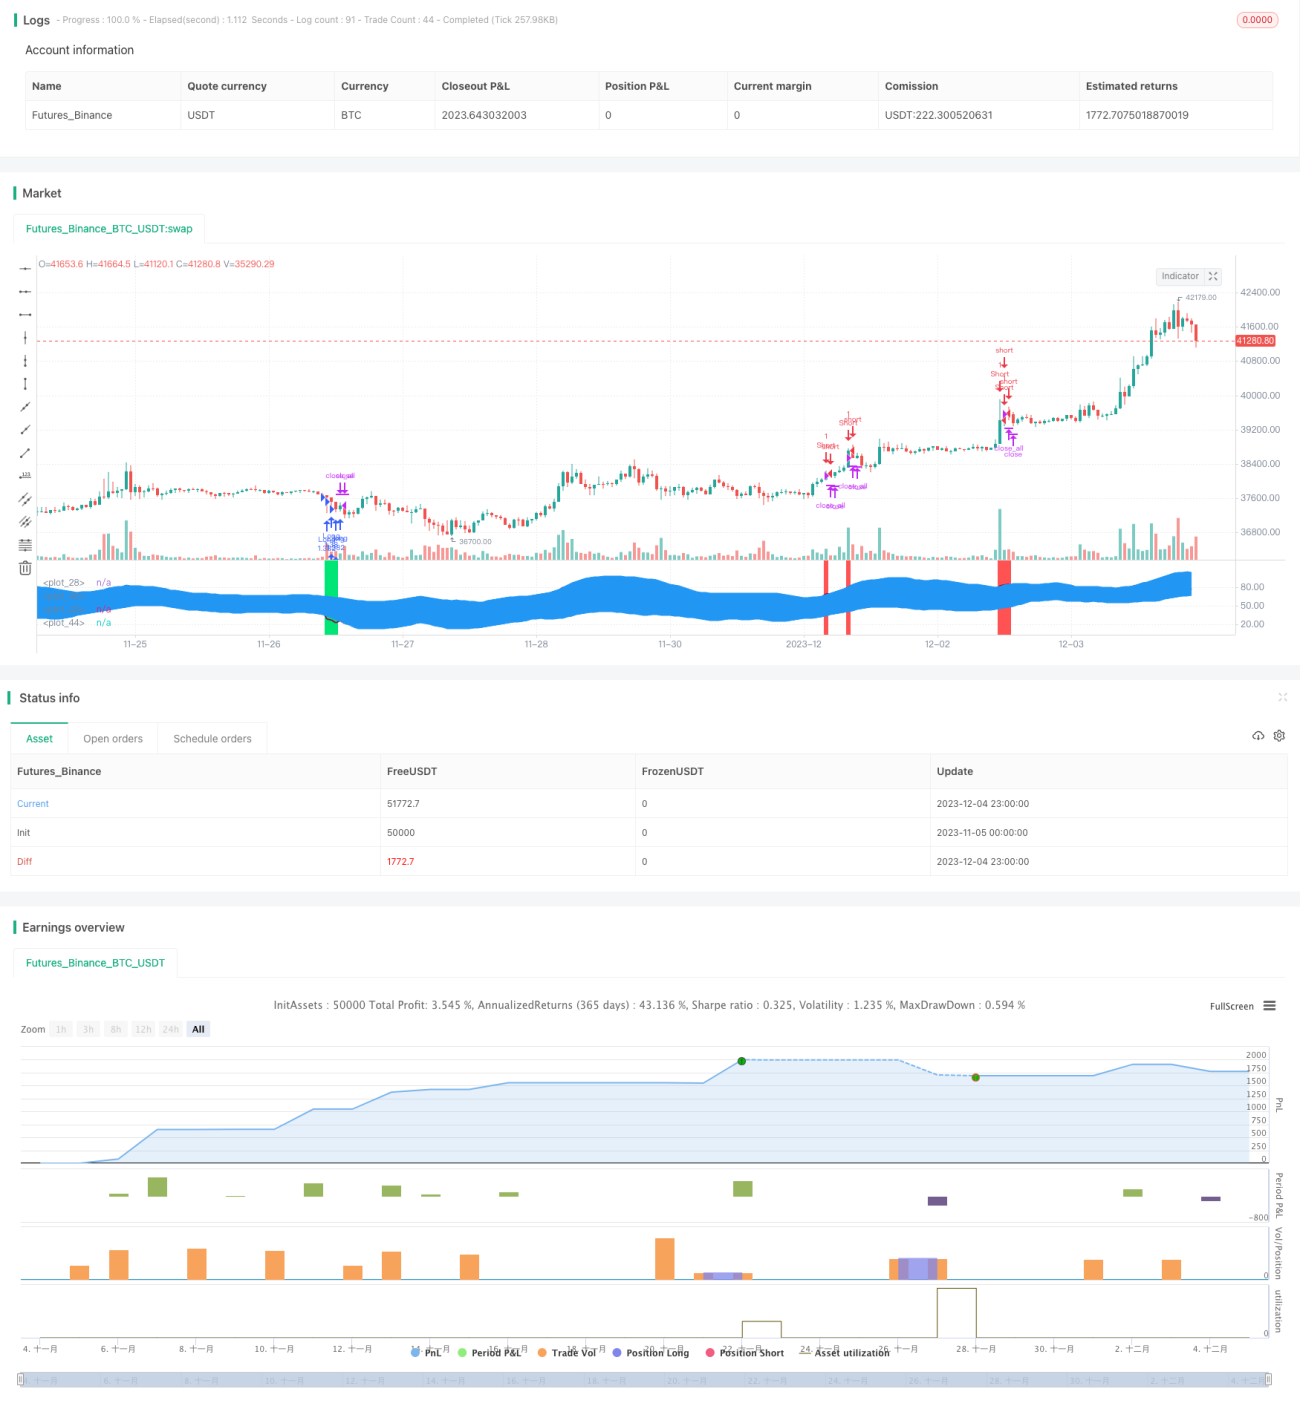
La stratégie est basée sur l'indicateur de pourcentage de la bande de Brin combiné avec les indicateurs RSI et MFI, en détectant que les prix des produits financiers ont percé la bande de Brin et sont descendus, en combinant les signaux de survente et de survente du RSI et du MFI, pour prendre des décisions plus ou moins favorables.
Principe de stratégie
- Calculer le pourcentage de la ceinture de Brin ((BB%)). Le BB% indique la différence de prix par rapport à la moyenne de la ceinture de Brin, et la direction du marché est déterminée par le canal de la ceinture de Brin.
- Combination des indicateurs RSI et MFI pour juger si une transaction est sur-achetée ou sur-vendue. Le RSI pour juger si une transaction est sur-achetée ou sur-vendue en comparant la hausse et la baisse moyennes sur une période donnée.
- Faire plus lorsque le prix est descendu de la barre de Brin de bas en haut; Faire plus lorsque le prix est descendu de la barre de Brin de haut en bas en haut. Filtrer les signaux de survente et de surachat en combinaison avec les indicateurs RSI et MFI.
Avantages stratégiques
- Il est important d'éviter les mouvements du marché et de réduire les fluctuations des bénéfices.
- La combinaison de plusieurs indicateurs permet de filtrer les signaux et d'améliorer la précision de la prise de décision.
- Les paramètres sont flexibles et la stratégie peut être adaptée en fonction des caractéristiques de risque/bénéfice.
- Il s'applique aux indices à forte volatilité tels que les matières premières, les devises et les crypto-monnaies.
Risques et solutions
- La rupture de la ceinture de Brin est plus susceptible de produire de faux signaux et nécessite un filtrage de plusieurs combinaisons d'indicateurs.
- Les signaux de rupture doivent être jugés avec la souplesse requise pour éviter de manquer une bonne occasion.
- Ajuster les paramètres de réglage pour contrôler le risque, par exemple en ajustant la taille de la position, en augmentant la limite de stop loss, etc.
Direction d'optimisation
- L'ajout de mécanismes de stop-loss basés sur la volatilité, tels que l'indicateur ATR.
- L'introduction d'un modèle d'apprentissage automatique pour aider à déterminer la qualité du signal de rupture.
- Optimiser le mécanisme de sélection des variétés participatives et adapter dynamiquement les critères de participation.
- Le système de prise de décision est amélioré en combinant des indicateurs d'humeur, des informations et d'autres éléments.
Résumer
Cette stratégie est principalement appliquée aux variétés non tendancielles à forte volatilité, permettant de réaliser des transactions de détrend grâce à une combinaison de chaînes de Bryn et d'indicateurs. Les paramètres peuvent être ajustés pour contrôler les caractéristiques de risque et de rendement.
Source
Pine
Strategy parameters
Related strategies
Comment
All comments (0)
No data
- 1