Stratégie standard de cassure des prix fractionnés

Aperçu
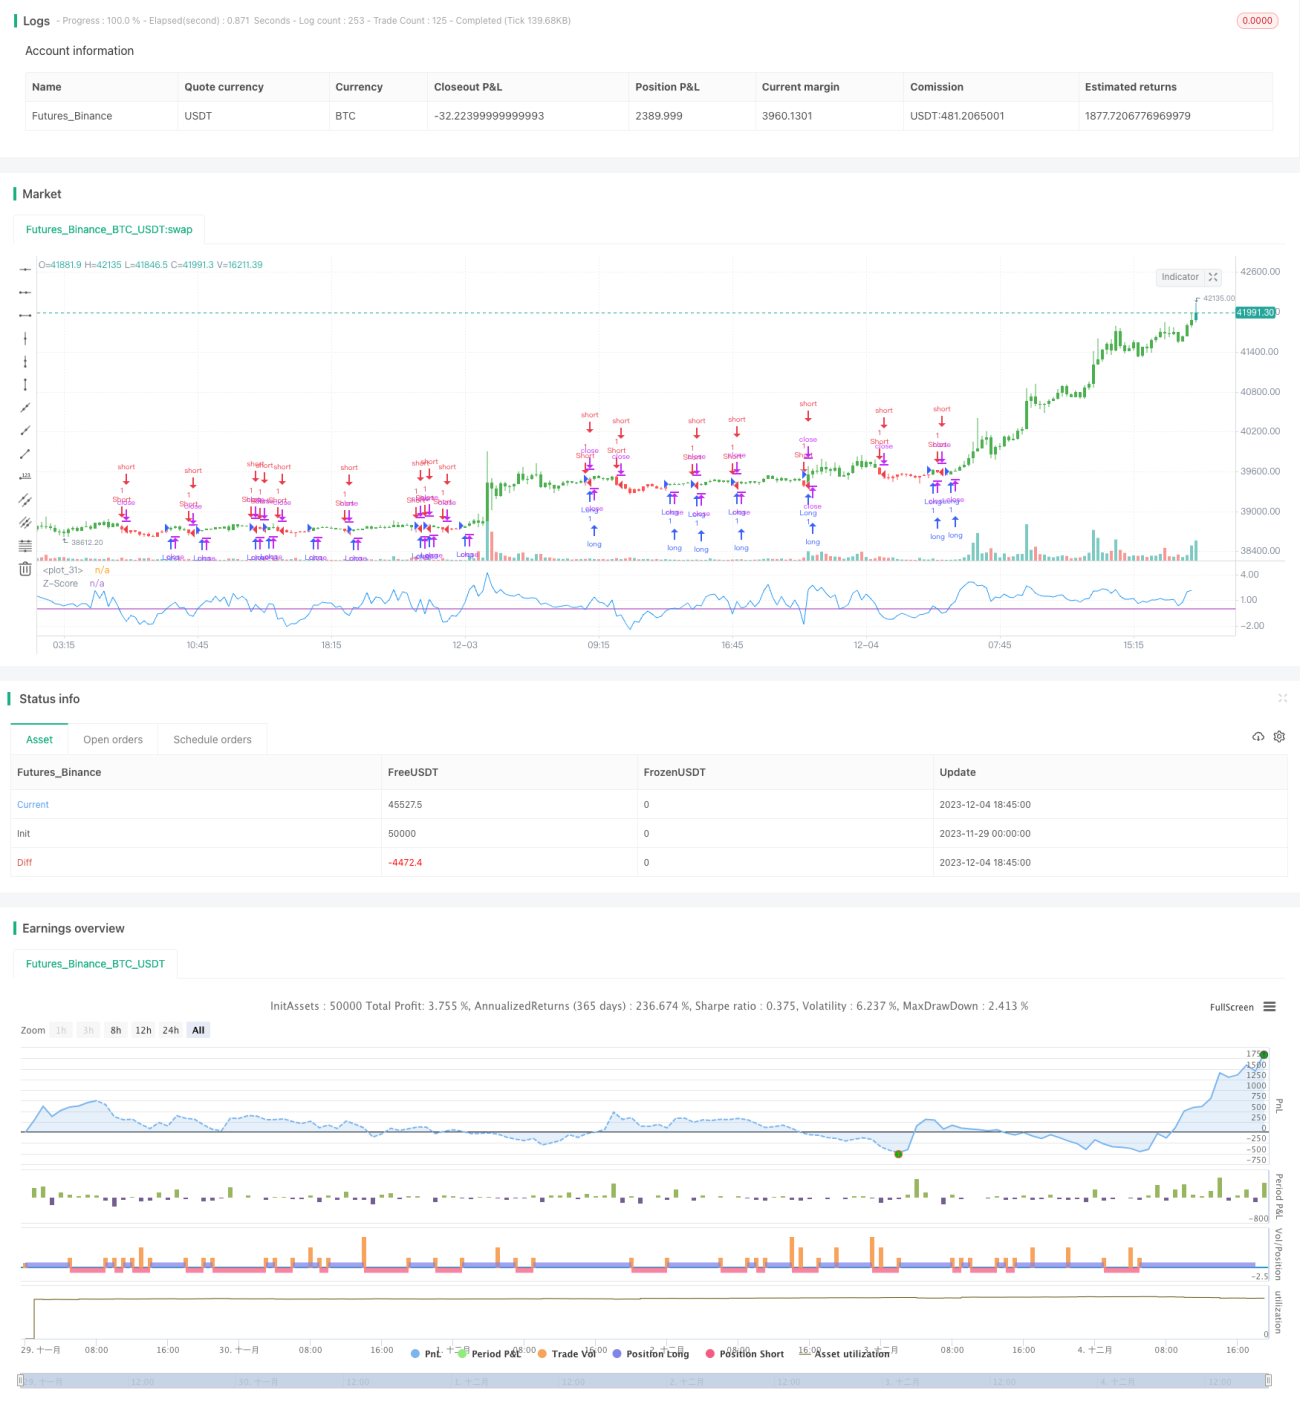
La stratégie Z-Score Price Breakout utilise l'indicateur Z-Score du prix pour déterminer si le prix actuel est dans un état anormal, générant ainsi un signal de négociation. Lorsque le score Z-Score du prix est supérieur ou inférieur à une certaine valeur, cela indique que le prix est entré dans un état anormal, ce qui peut entraîner des opérations de plus ou de moins.
Principe de stratégie
L'indicateur central de cette stratégie est le score standard de prix (Z-Score), calculé selon la formule suivante:
mylang
Z_score = (C - SMA(n)) / StdDev(C,n)
où C est le prix de clôture, SMA (n) est la moyenne mobile simple pour n cycles, et StdDev (C,n) est la différence standard pour le prix de clôture pour n cycles.
Le score standard reflète le degré d'écart entre le prix actuel et le prix moyen. Lorsque le score standard est supérieur à une certaine marge positive (par exemple, +2), le prix actuel est supérieur à la moyenne de 2 écarts standards et appartient au niveau relativement élevé.
La stratégie commence par calculer le score standard du prix, puis définit un seuil positif-négatif (comme 0 et 0), générant un signal d'achat lorsque le score standard est supérieur au seuil positif et un signal de vente lorsque le score standard est inférieur au seuil négatif.
Analyse des avantages
- L'utilisation d'un score standard de prix pour détecter une anomalie de prix est une méthode de quantification courante et efficace.
- Les transactions bidirectionnelles en plus et en moins sont faciles.
- Réglages de paramètres flexibles, cycles réglables, valeurs de seuil, etc.
- Peut être combiné avec d'autres indicateurs pour former un système de négociation
Analyse des risques
- Les stratégies de notation standard sont plus larges et plus susceptibles de générer de faux signaux
- Il faut définir des paramètres appropriés, tels que les cycles et les seuils
- Une stratégie de réduction des pertes et de maîtrise des risques
Direction d'optimisation
- Optimiser les paramètres de cycle pour trouver le cycle optimal
- Optimisation des seuils positifs et négatifs pour réduire les faux signaux
- Augmentation des conditions de filtrage, combinée à d'autres indicateurs
- Augmentation des stratégies de réduction des pertes
Résumer
La stratégie de rupture des prix des scores standard permet de déterminer si le prix actuel est anormal et de négocier en fonction du positif négatif des scores standard des prix. La stratégie est simple et facile à utiliser, mais elle présente également un certain risque.
/*backtest
start: 2023-11-29 00:00:00
end: 2023-12-04 19:00:00
period: 15m
basePeriod: 5m
exchanges: [{"eid":"Futures_Binance","currency":"BTC_USDT"}]
*/

//@version=2
////////////////////////////////////////////////////////////
//  Copyright by HPotter v1.0 18/01/2017
// The author of this indicator is Veronique Valcu. The z-score (z) for a data - 1