Stratégie de trading intraday : points clés

1
Follow
1779
Followers
Aperçu
Il s'agit d'une stratégie de points clés pour le day trading en Inde, qui utilise principalement le prix d'ouverture, le prix le plus élevé, le prix le plus bas et le prix de clôture pour calculer les points clés de soutien et de résistance, et pour négocier lorsque ces points sont franchis.
Principe de stratégie
- Calculer le prix le plus élevé, le prix le plus bas et le prix de clôture du jour précédent
- Calculer le point de support principal S1, le point de résistance R1 et le point critique PP selon la formule
- Lorsque le prix franchit ces points critiques, vous entrez en position de vente ou de vente.
- Mise en place d'un mécanisme d'arrêt des pertes
La formule de calcul des points clés est la suivante:
PP = (最高价+最低价+收盘价)/3
R1 = 2*PP - 最低价
S1 = 2*PP - 最高价
Analyse des avantages
- Utilisez les points clés pour créer des opportunités de profit grâce à des ouvertures à forte probabilité
- Les points clés sont faciles à identifier et les règles de négociation sont claires
- Les points de rupture sont faciles à définir et permettent de maîtriser les risques.
Analyse des risques
- Les points critiques peuvent provoquer de fausses percées et des pertes
- La validité des points clés doit être vérifiée et ne doit pas nécessairement fonctionner à chaque fois.
- Une mauvaise configuration du point de rupture peut augmenter les pertes
Comment gérer les risques:
- combining with other indicators to filter false breakouts
- backtesting to validate strategy over long timeframes
- optimize stop loss placement
Direction d'optimisation
- Filtrage des fausses signaux de rupture en combinaison avec d'autres indicateurs techniques
- Optimisation des paramètres pour les différentes variétés
- Dynamique des points d'arrêt
Résumer
L'ensemble de la stratégie est simple et direct, et son efficacité est facilement vérifiable à l'aide de données historiques. En tant que stratégie de day trading, elle utilise les points critiques pour fournir des points de rupture à haute probabilité, ce qui peut avoir de bons résultats.
Source
Pine
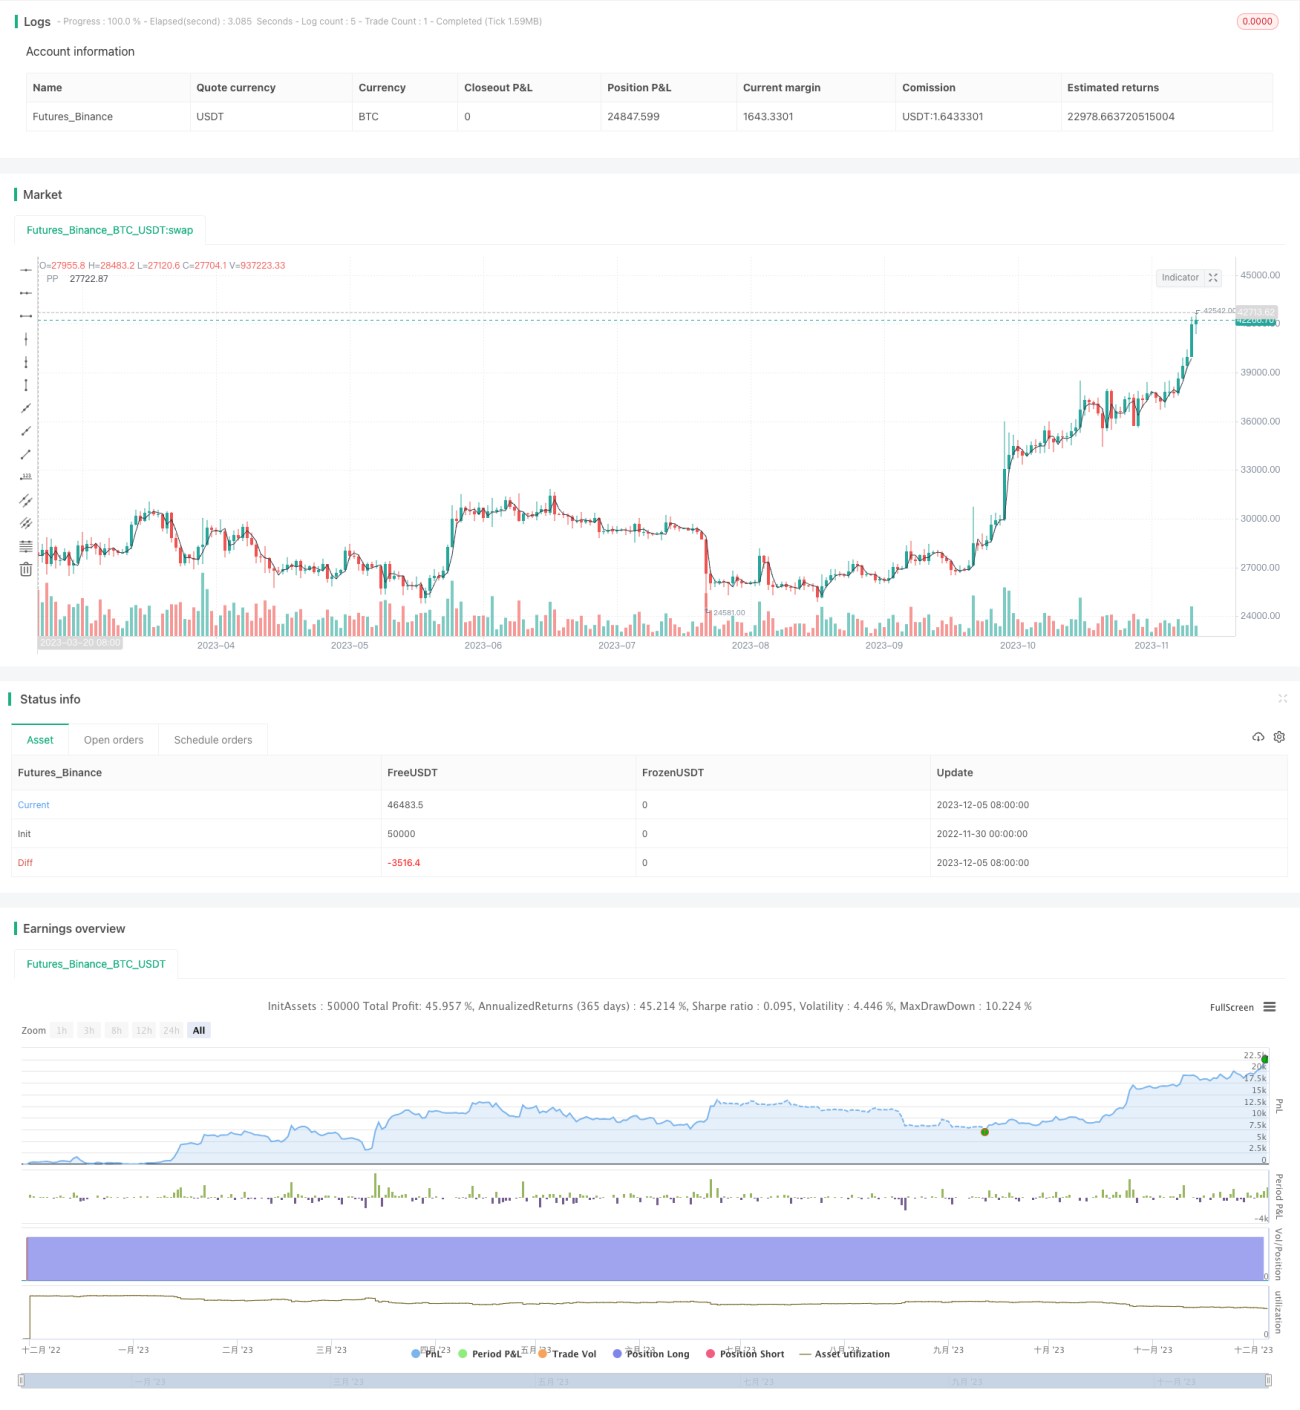
/*backtest
start: 2022-11-30 00:00:00
end: 2023-12-06 00:00:00
period: 1d
basePeriod: 1h
exchanges: [{"eid":"Futures_Binance","currency":"BTC_USDT"}]
*/

// This source code is subject to the terms of the Mozilla Public License 2.0 at https://mozilla.org/MPL/2.0/
// © arameshraju
//Reference credit goes to All
Strategy parameters
Related strategies
Comment
All comments (0)
No data
- 1